
Forex Risk Management: The Complete Guide
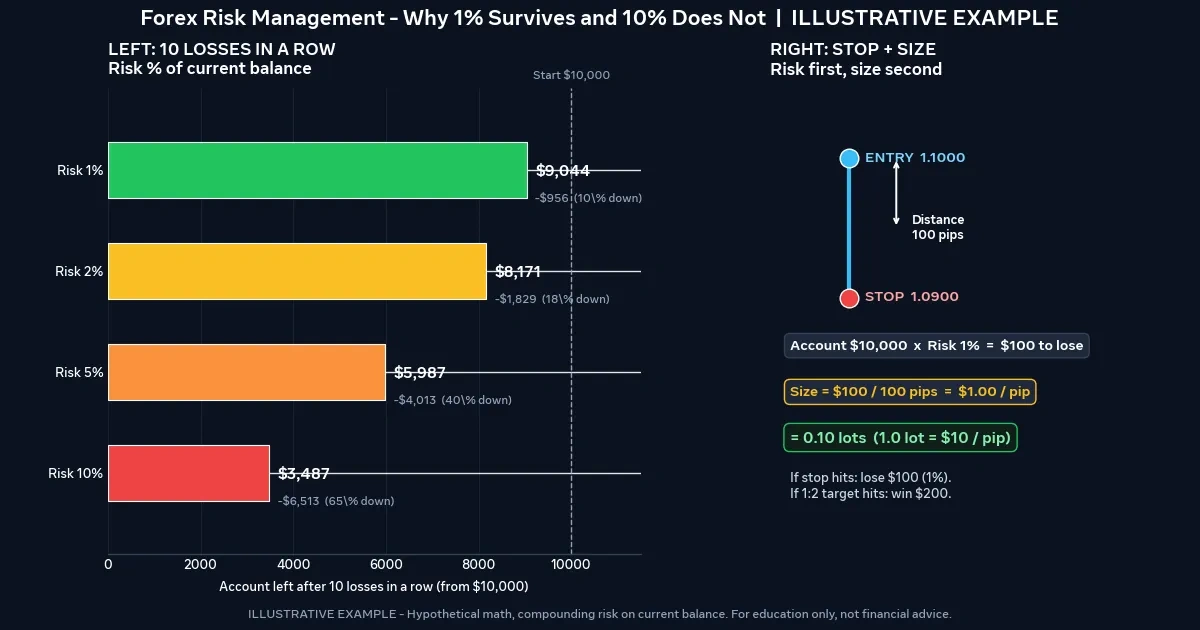
Picture two traders who run the same strategy and hit the same ten losses in a row. One risked 1% of the balance per trade and still holds about $4,522 of a $5,000 account. The other risked 10% per trade and is down to about $1,743. Nothing about their analysis differed. Only their sizing did. That gap is the heart of forex risk management: a set of rules that decides how much you can lose before you place a trade, so a bad stretch hurts but doesn’t end your trading.
Four Levers That Decide Whether You Survive a Bad Month
- Trade size: Set it from your stop distance and a fixed percentage of your account, not from a feeling about the setup.
- Stop placement: Put the stop where the trade idea is wrong, then size the position to fit it. Never shrink the stop to fit a larger position.
- Total exposure: Count correlated trades as one bet, and cap the combined risk you hold at any moment.
- Loss limits: Decide in advance when you stop for the day, the week, and the drawdown, while you’re calm.
What Risk Controls Cannot Protect You From
Risk management reduces losses. It doesn’t remove them, and a plan that ignores its own limits is a trap. Know these limits before you rely on the rules below.
Gaps and slippage. A stop order becomes a market order once price reaches it, so it fills at the next available price, which may be worse. Weekend gaps and major news releases can jump past your stop entirely. Your realized loss can then exceed the planned one. Some brokers offer price-assured stop orders, usually at an extra cost, and the terms vary by provider.
Leverage and margin calls. Leverage lets you control a position much larger than your deposit. It magnifies gains and losses equally, and a trader can lose some or all of the account. Margin levels, stop-out rules, and negative balance protection differ by broker and by country, so read your own account terms.
Counterparty and platform risk. Your broker’s financial health, execution quality, and platform uptime sit outside your control. Check how a broker is regulated where you live, because rules vary by country.
Your own behavior. The best rule set is worthless if you override it after three losses. This is the most common failure, and the later sections on loss limits address it directly.
The Arithmetic of Losing: Why a 50% Drawdown Needs a 100% Gain
Losses are asymmetric. A drawdown (the drop from an account’s peak value) requires a larger percentage gain to undo, and the gap widens fast. The recovery formula is: gain needed = loss ÷ (1 − loss).
| Account loss | Gain needed to get back to even |
|---|---|
| 5% | 5.26% |
| 10% | 11.11% |
| 20% | 25.00% |
| 30% | 42.86% |
| 50% | 100.00% |
| 70% | 233.33% |
Now apply it to losing streaks. The table below assumes ten consecutive losing trades, each risking a fixed percentage of the current balance, starting from $5,000.
| Risk per trade | Balance after 10 losses | Total drawdown |
|---|---|---|
| 1% | $4,522 | 9.6% |
| 2% | $4,085 | 18.3% |
| 5% | $2,994 | 40.1% |
| 10% | $1,743 | 65.1% |
The calculation is balance × (1 − risk)¹⁰. At 2%, that is 0.98¹⁰ ≈ 0.817. At 10%, it is 0.90¹⁰ ≈ 0.349.
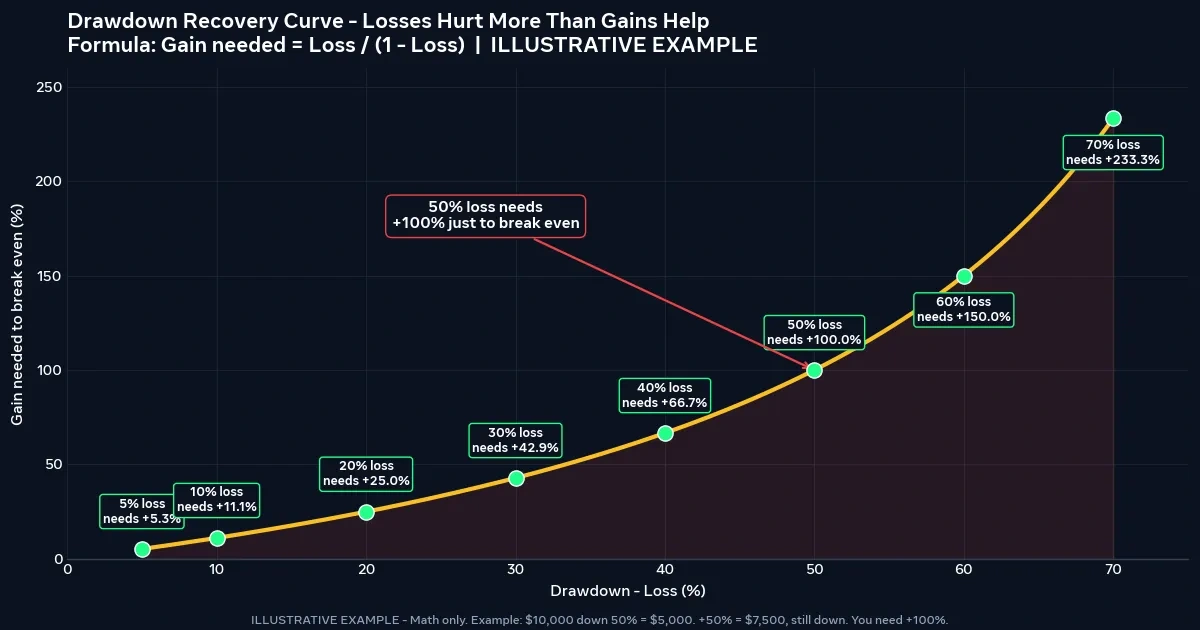
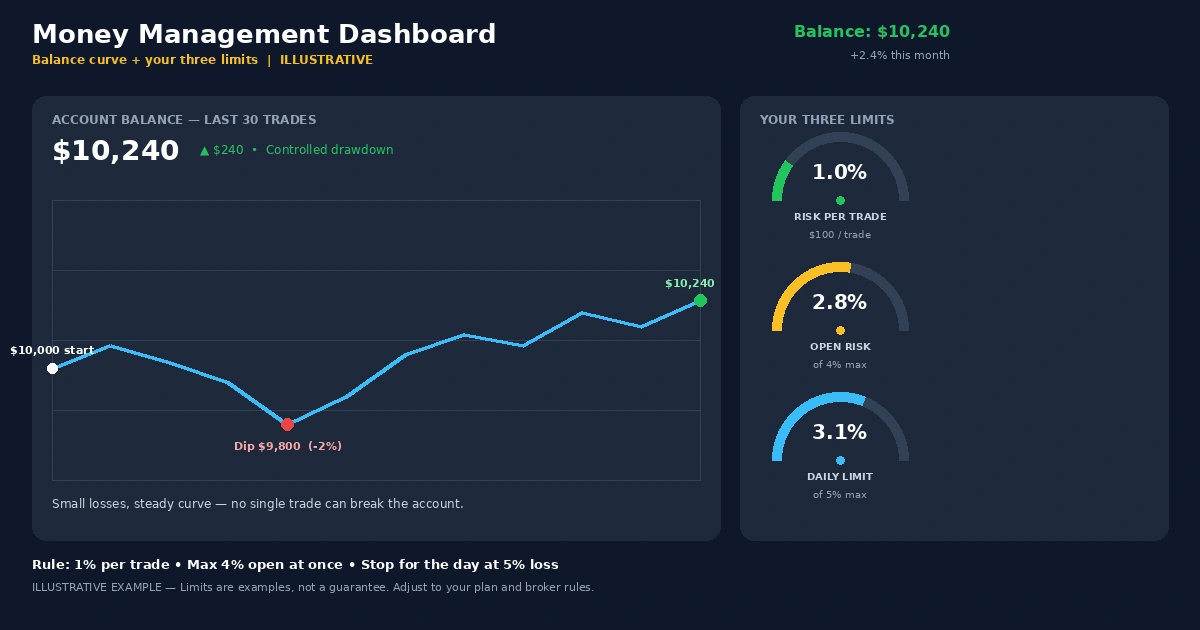
Many traders keep risk per trade in a low single-digit range, often 1% to 2% or less, for exactly this reason. Larger bets don’t just lose faster. They push you into the part of the recovery curve where getting back to even takes a very long run. The right level depends on your strategy, account size, and tolerance for drawdowns. As the guide on why risk management matters more than strategy argues, sizing often decides outcomes more than entries do.
Sizing a Trade From the Stop Backward
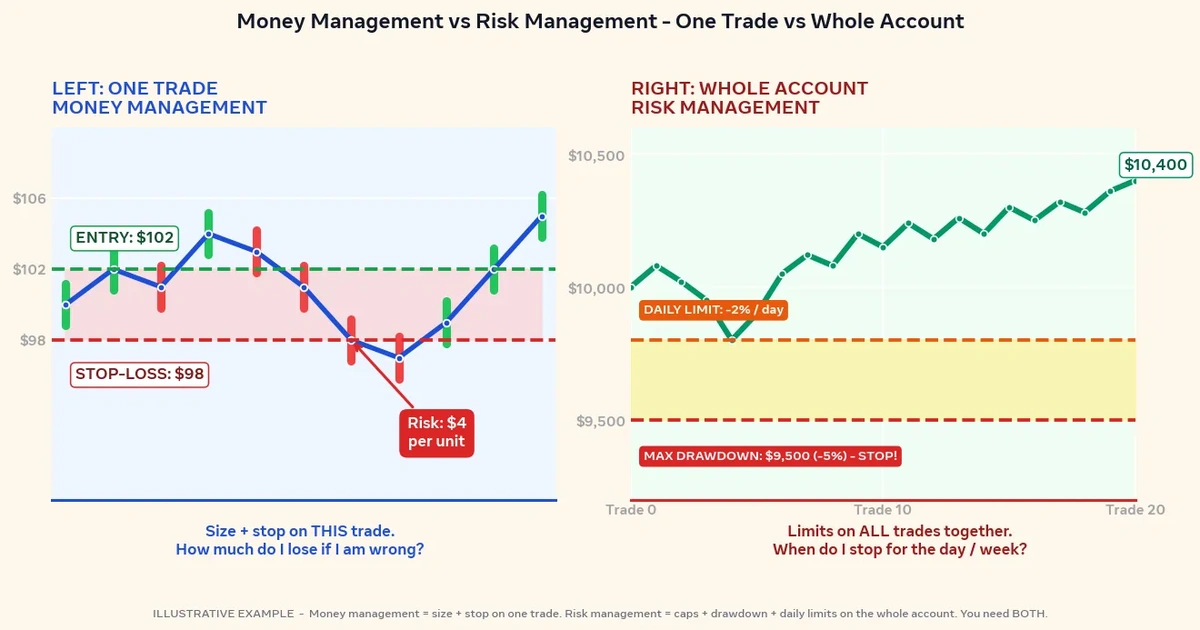
Position sizing works in a fixed order. Decide where the trade is wrong, measure that distance, then calculate how many units you can hold while losing only your chosen percentage if the stop hits.
Position size (standard lots) = (Account balance × Risk %) ÷ (Stop distance in pips × Pip value per standard lot)
Pip value depends on the pair and your account currency. For a pair quoted in your account currency, such as GBP/USD on a USD account, it is a fixed $10 per standard lot. For other pairs it changes with the exchange rate. The guide to account currency, pip value, and profit calculation covers those conversions.
A $4,000 Account, a 30-Pip Stop, and 20 Micro Lots
This is a hypothetical example for illustration only. A trader has $4,000 and risks 1.5% per trade. A GBP/USD long has its invalidation point 30 pips below entry.
- Dollar risk: $4,000 × 0.015 = $60
- Risk per standard lot: 30 pips × $10 = $300
- Size: $60 ÷ $300 = 0.20 lots, which is 20 micro lots at $2 per pip
- Target: 60 pips away, a 2:1 reward-to-risk on paper
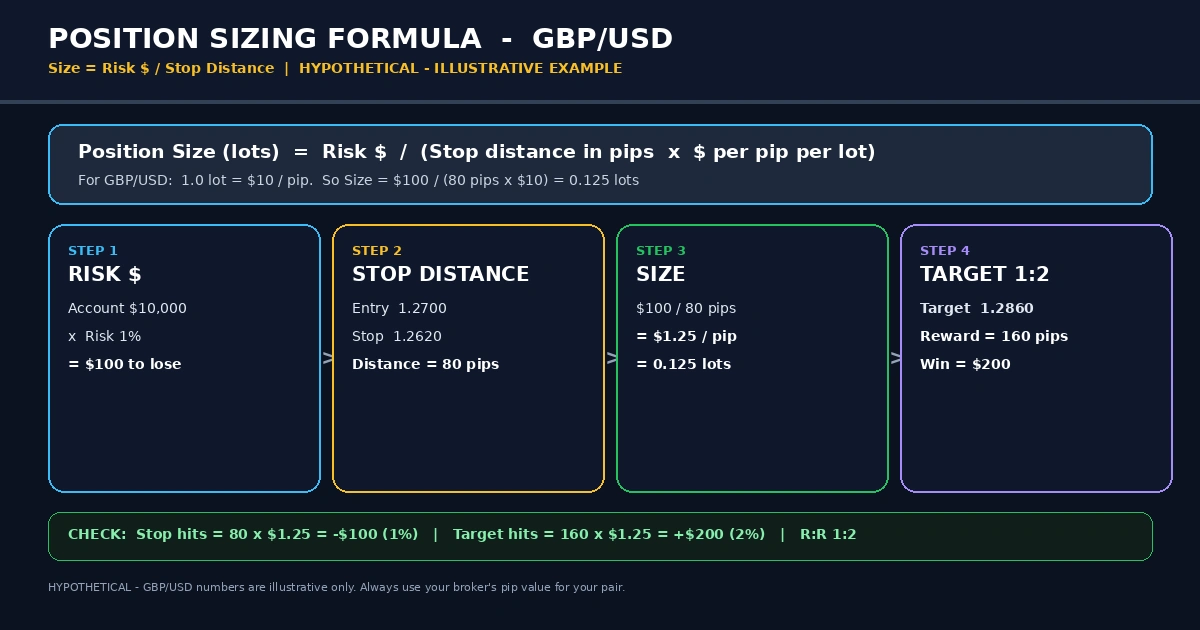
Costs change the picture. Assume spread plus slippage adds 1.5 pips of friction. The stop-out loss becomes 31.5 × $2 = $63, or 1.575% of the account. The winning trade nets 58.5 × $2 = $117. The real reward-to-risk is about 1.86:1, not 2:1. Small frictions shave the ratio on every trade.
When the Account Is Too Small for the Math
Take a $500 account risking 1%, or $5, with the same 30-pip stop. One micro lot risks 30 × $0.10 = $3. Two would risk $6, which is above the limit. The rounded-down answer is one micro lot, and the effective risk is $3, or 0.6%. Minimum lot sizes can force very small accounts to risk more or less than the plan. Round down, never up, and if even the minimum size breaks your limit, widen nothing and skip the trade.
Leverage, Margin, and the Gap Between Notional Size and Real Risk
Margin is the deposit your broker holds while a position is open. It is not the amount you can lose. Mixing the two up is a common beginner error.
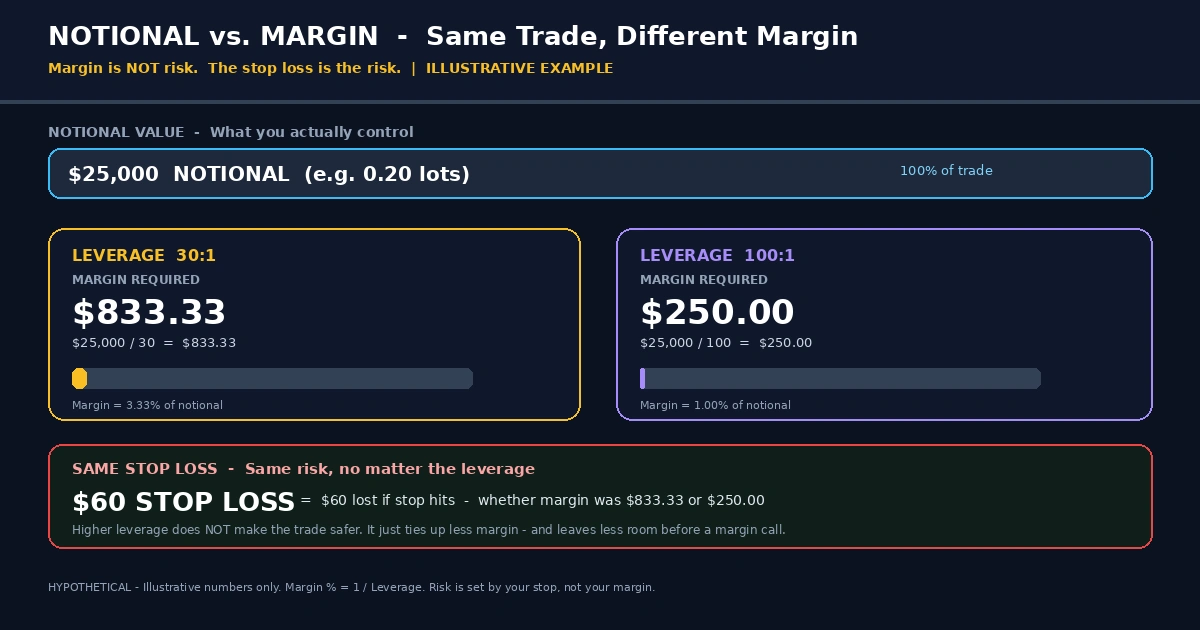
Using the same hypothetical 0.20-lot GBP/USD trade at an invented price of 1.2500, the notional value is 20,000 × 1.25 = $25,000. At 1:30 leverage, the required margin is $25,000 ÷ 30 = $833.33. At 1:100, it is $250.00. In both cases the loss if the stop hits is the same $60 to $63. Leverage only changes how much of your balance is tied up.
What matters for risk is effective leverage: notional exposure divided by account equity. Here it is $25,000 ÷ $4,000 = 6.25:1, whatever the broker’s maximum allows. Higher available leverage makes oversizing easier, and oversizing is what hurts. Brokers’ stop-out thresholds differ, so confirm the level on your own account.
Where the Stop Belongs: Market Structure, Volatility, or a Fixed Number
A stop should sit at a price where your trade idea is proven wrong. Three common approaches:
- Structure-based: Beyond a swing high or low, or beyond a zone you identified. It ties the stop to the reason for the trade.
- Volatility-based: A multiple of Average True Range (ATR, a measure of recent typical price movement). It adapts the stop to how much the pair currently moves.
- Fixed pips: Simple, but it ignores changing volatility, so the same 20 pips can be too tight on a news day and too loose in a quiet session.
Whichever method you pick, the order doesn’t change. Place the stop, measure the distance, then size the position. If the resulting size is too small to be worthwhile, the answer is to skip the trade. Don’t tighten the stop below the point where the idea fails.
Use hard stops (orders placed with the broker) in preference to mental ones. A mental stop depends on you being at the screen and in the right frame of mind at the worst moment. Widening a stop after entry is the most damaging habit here, because it converts a planned loss into an open-ended one.
Reward-to-Risk and Win Rate: The Break-Even Table
Reward-to-risk (R:R) compares the distance to your target with the distance to your stop. The win rate you need to break even follows from it: break-even win rate = 1 ÷ (1 + R:R), before costs.
| Reward-to-risk | Break-even win rate |
|---|---|
| 0.5:1 | 66.7% |
| 1:1 | 50.0% |
| 1.5:1 | 40.0% |
| 2:1 | 33.3% |
| 3:1 | 25.0% |
These are arithmetic about payoffs, not predictions about how often a setup wins. A higher R:R doesn’t help if targets are rarely reached, and a high win rate doesn’t help if the average loss dwarfs the average win. Expectancy combines both: (win rate × average win in R) − (loss rate × average loss in R).
This is a hypothetical example for illustration only. Suppose a system wins 40% of trades at 2R and loses 60% at 1R. Expectancy is (0.40 × 2) − (0.60 × 1) = +0.20R per trade. If costs average 0.05R per trade, that falls to +0.15R. Nothing in these figures is a forecast.
Even with positive expectancy, streaks happen. With a 40% win rate, eight losses in a row has a probability of 0.60⁸ ≈ 1.7% on any given run. Across a few hundred trades, a streak like that can easily appear, which is why the sizing table earlier in this guide matters.
Three Positions, One Dollar View: Correlated Exposure
Opening several trades doesn’t diversify you if they all express the same idea. Long EUR/USD, long GBP/USD, and long AUD/USD are, in large part, three bets that the US dollar weakens. If the dollar rallies broadly, all three stops can trigger together. Three trades risking 1% each then behave like a single trade risking close to 3%.
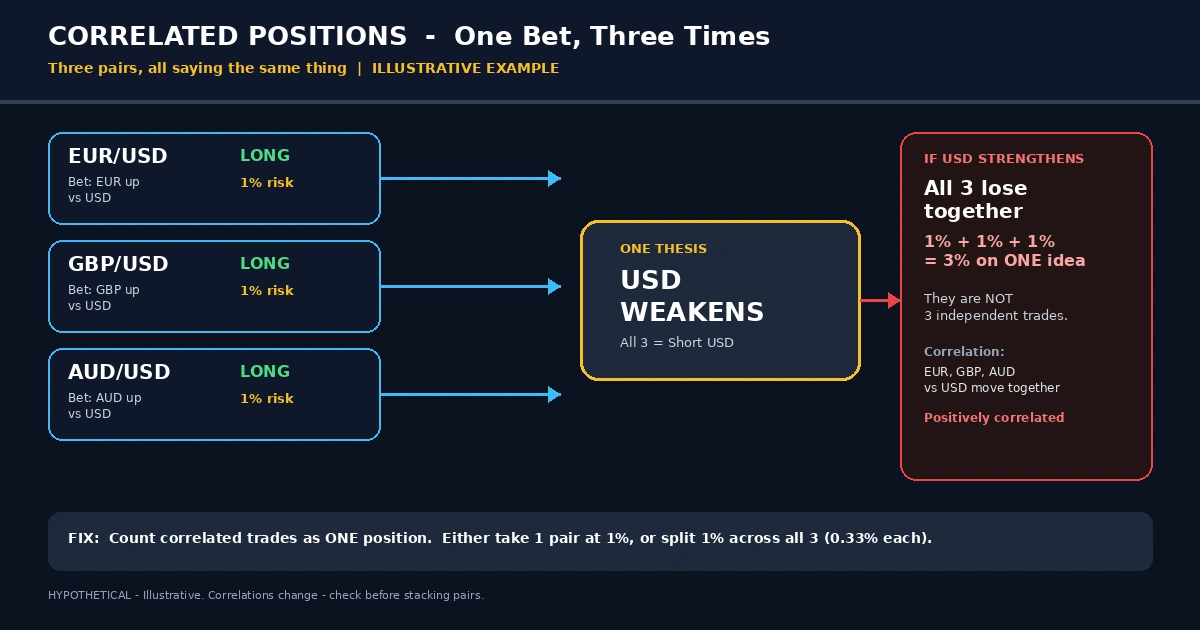
Currency correlations shift over time, so treat them as tendencies and recheck them. A practical response is a cap on open risk. For example, a trader might hold no more than 3% combined risk across open positions and count tightly correlated pairs together. Mixed positions, such as long EUR/USD and long USD/CHF, can also offset or overlap in ways that aren’t obvious at first glance.
Loss Limits That Work When Your Judgment Doesn’t
Losing trades cloud judgment. The urge to win it back fast tends to produce larger sizes, looser stops, and trades outside the plan. The fix is to set the limits when you’re calm, and write them down. The guide on how emotions affect trading decisions explains why this pattern is so common.
These are sample settings, hypothetical and meant as starting ideas for your own plan:
- Daily stop: Done for the day after a 3% account loss or three losing trades in a row.
- Weekly stop: Done for the week after a 6% loss.
- Drawdown step-down: Cut risk per trade by half (from 1.5% to 0.75%) after a 10% drop from the account’s peak. Pause and review after 20%.
- Reset rule: Return to full size only after a set number of trades followed the plan, whatever their outcome.
A step-down has a clear logic. At a 20% drawdown, you need a 25% gain to recover, and a smaller size slows the damage while you work out whether the problem is the strategy, the market, or your execution.
Writing a One-Page Risk Plan
Put all of this on one page before the next trade. A sample, with hypothetical values:
| Rule | Sample setting |
|---|---|
| Risk per trade | 1.5% of current balance |
| Maximum open risk | 3%, counting correlated pairs together |
| Minimum reward-to-risk | 1.5:1 after spread and slippage |
| Daily stop | 3% loss or three consecutive losses |
| Weekly stop | 6% loss |
| Drawdown response | Half size at −10% from peak, pause at −20% |
| Stop rule | Placed before entry, never widened |
| News rule | No new entries just before high-impact releases |
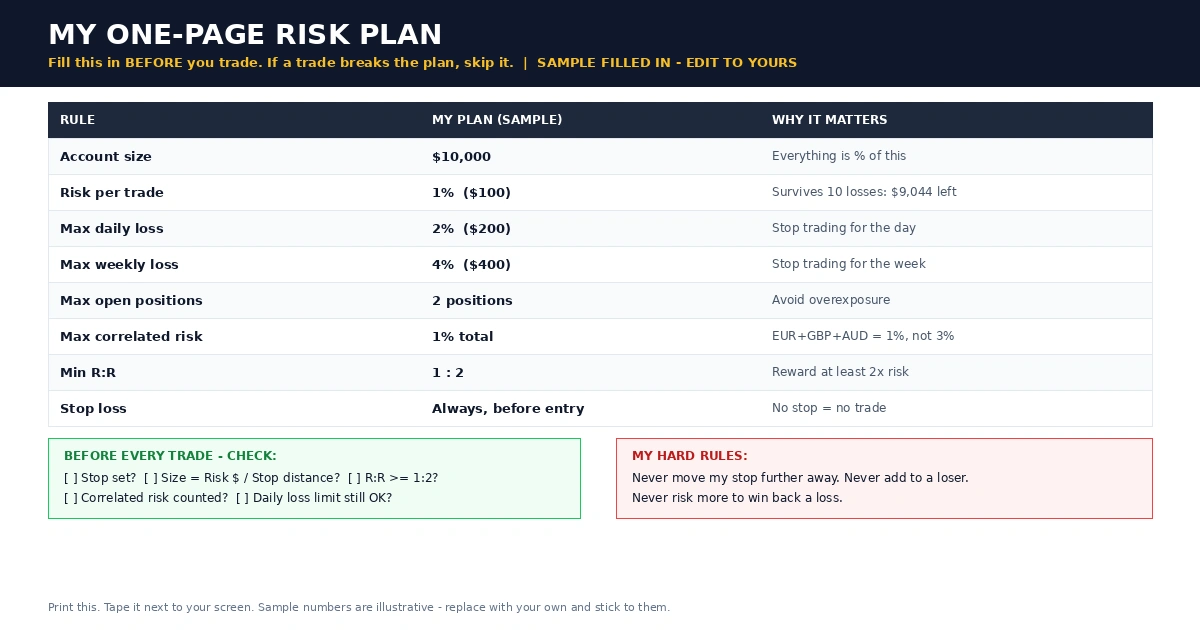
Your numbers will differ. What counts is that every row has a number and the page exists before the trade does. Review it after each month, and change it only on review days, never mid-trade.
Habits That Quietly Drain Small Accounts
- Sizing by available margin. The platform lets you open a large position, so you do. Margin capacity isn’t a risk limit.
- Raising size after a win. Confidence rises with the balance, but the extra risk lands on the same unproven edge.
- Averaging down. Adding to a losing position without a new, predefined stop multiplies the loss that the first stop was meant to cap.
- Ignoring costs in the ratio. A planned 2:1 that nets 1.86:1 changes the break-even win rate, and over many trades that adds up.
- Treating a break-even stop as free. Moving the stop to entry can protect a trade, but it also stops you out on ordinary pullbacks. Test the effect on your own history before adopting it.
- Skipping the journal. Without records, you can’t tell whether losses came from the strategy or from broken rules.
Straight Answers on Risk Percentages, Stops, and Drawdowns
What percentage should I risk per trade?
There’s no universal number. Many traders risk a small fixed percentage, often discussed in a range from under 1% to around 2%. The right level depends on your strategy’s win rate, your account size, and how much drawdown you can tolerate. A smaller percentage survives longer losing streaks.
Is a stop-loss enough to manage risk?
No. A stop caps the planned loss per trade, but position size decides how large that loss is. Gaps, slippage, correlated positions, and overriding your own rules can all push real losses past the plan. A stop is one control among several.
Does lower leverage make trading less risky?
Leverage sets how much margin a position needs, not how much you lose. Your stop distance and position size set the loss. Lower available leverage can make oversizing harder, which helps, but a small account with a tight stop and a modest size can hold low risk at high leverage.
What risk-to-reward ratio should I use?
It depends on your win rate. A 2:1 ratio breaks even at about a 33.3% win rate before costs, while a 1:1 ratio needs 50%. Include spread and slippage when you calculate, because they reduce the real ratio.
Should I move my stop to breakeven?
It’s a trade-off. It can protect a trade that has moved in your favor, but it also gets you stopped out on normal pullbacks before the move continues. Test it on past trades and a demo account before deciding.
How much drawdown is too much?
That’s personal, so decide in advance. A 20% drawdown needs a 25% gain to recover, and a 50% drawdown needs 100%. Many traders set a threshold for cutting size and another for pausing, and write both down before they’re tested.
Survival Is a Position-Sizing Decision
Risk management comes down to a single habit: decide the loss before you decide the trade. A fixed percentage, a stop placed where the idea fails, a cap on combined exposure, and limits set in advance won’t make trades win. They determine whether a losing streak is a setback or the end. For your next step, pull your last ten closed trades and calculate each stop’s distance as a percentage of the account. If the numbers vary widely, you have moods, not a rule.
Disclaimer
This article is for educational purposes only and is not financial advice. Forex and CFD trading involves a high level of risk, and you can lose some or all of your capital. Leverage can magnify both gains and losses. Never trade with money you can’t afford to lose.
This is educational content, not personalized investment advice. Your financial situation, goals, and local regulations are different, so consider speaking with a licensed financial professional before making decisions.
Any percentages or figures shown are historical averages or hypothetical examples, not guarantees. Past performance does not predict future results.
Join now
Comments (0)
Be the first to comment.