
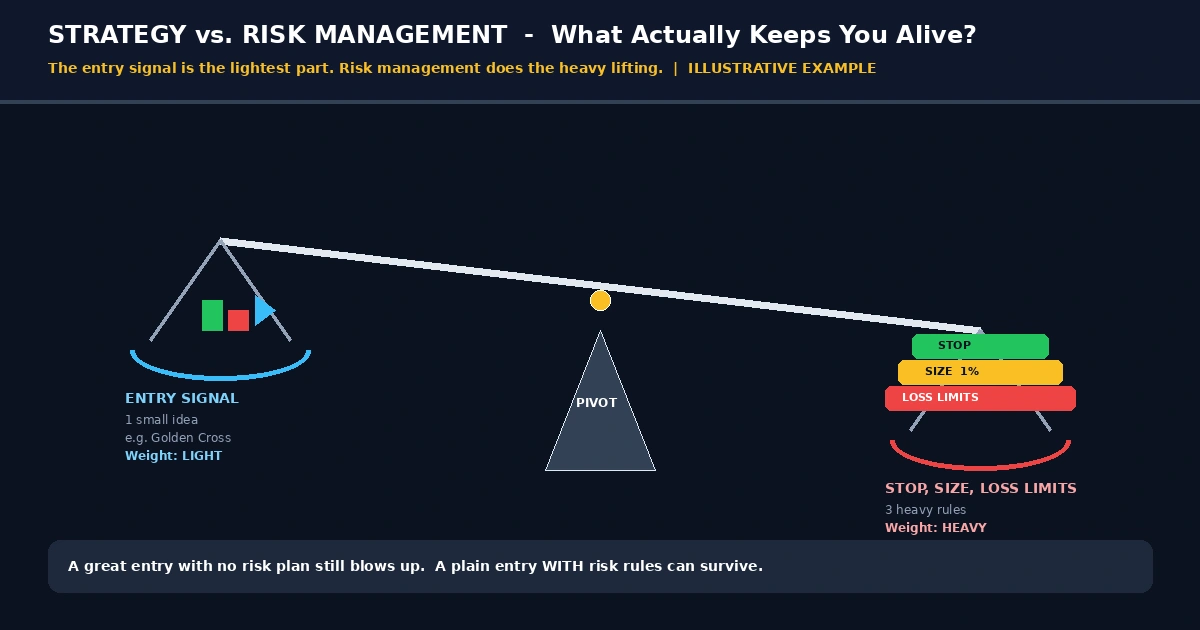
Why Risk Management Matters More Than Your Strategy
A hypothetical system wins 70% of its trades and still loses money over a long run. That sounds like a trick, but it’s plain arithmetic: the wins are small, the losses are large, and no entry signal can repair that. It’s the clearest case for why risk management matters more than strategy. Your setup decides when you enter. Your stop, position size, and loss limits decide what each outcome costs you, and those costs compound. The numbers below show why, and where the argument stops holding.
Strategy Picks the Trade, Risk Rules Pick the Outcome
- Strategy is a guess with an unknown edge. Risk rules decide how much each wrong guess costs, which is the one part fully in your control.
- Win rate alone says little. What counts is expectancy: (win rate × average win) − (loss rate × average loss), measured in R, your planned risk per trade.
- One oversized loss can erase many disciplined wins. A single broken rule often does more damage than a mediocre entry method.
- Short samples are noisy. You can’t know your edge early, so small fixed risk buys the time to find out.
- Sizing can’t rescue a negative edge. It only slows the losses. A strategy still has to earn its place.
A 70% Win Rate That Still Loses Money
R is your planned loss on one trade. If you risk $100, a stopped-out trade is −1R, and a $200 gain is +2R. Expectancy is the average result per trade in R, before costs.
This is a hypothetical example for illustration only. These five invented profiles show how little win rate tells you on its own:
| Win rate | Average win | Average loss | Expectancy per trade |
|---|---|---|---|
| 70% | 0.4R | 1R | −0.02R |
| 55% | 1R | 1R | +0.10R |
| 40% | 2R | 1R | +0.20R |
| 30% | 3R | 1R | +0.20R |
| 35% | 2R | 1R | +0.05R |
The first row has the most impressive win rate and the only negative result: (0.70 × 0.4) − (0.30 × 1) = 0.28 − 0.30 = −0.02R. The 30% profile loses seven trades in ten and still comes out ahead, because its winners are three times its losers.
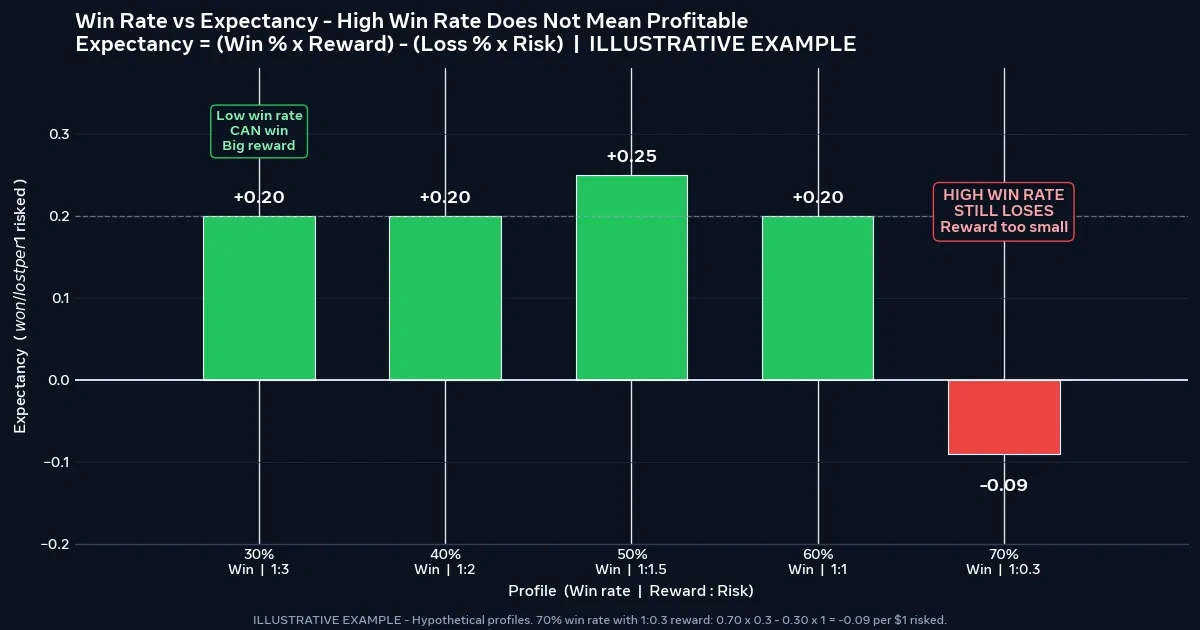
Now add costs. Spread (the gap between buy and sell prices), commission, and slippage (fills that land away from the price you wanted) all eat into every trade. If they average 0.05R per trade, the first row drops to −0.07R and the last drops to 0.00R. A thin edge can disappear into friction.
Notice what creates the payoff shape. It comes from where you place your stop and your target, which are risk decisions, not entry decisions. Two traders can take the identical entry and end up with different expectancy because one cuts winners short and lets losers run.
Nine Disciplined Wins and One Broken Rule
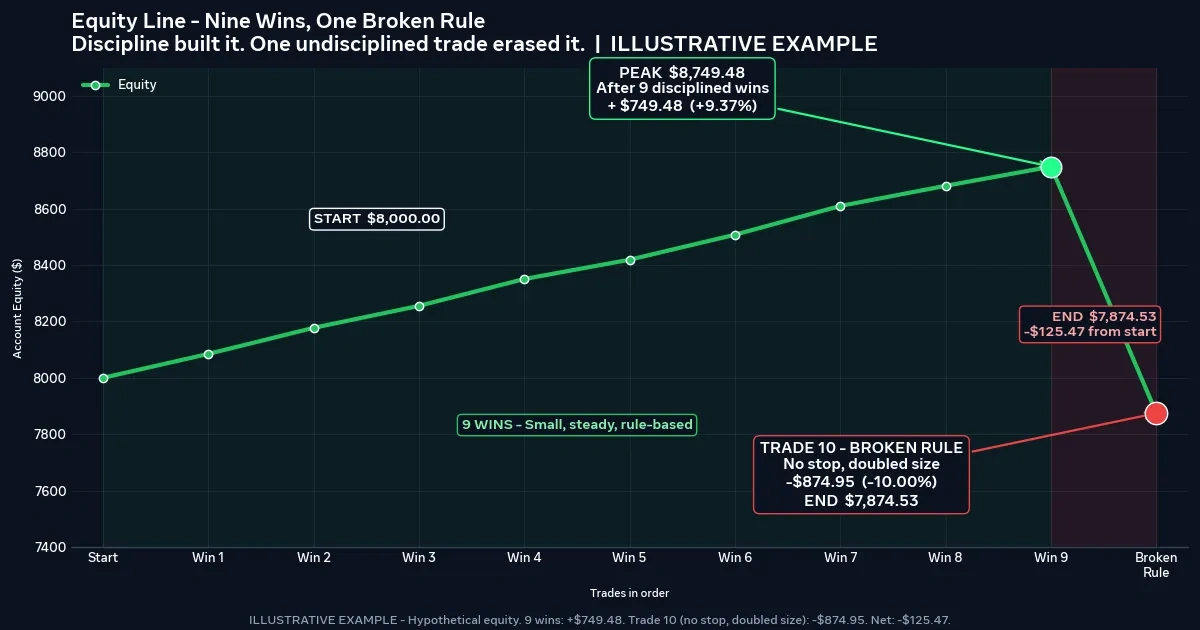
This is a hypothetical example for illustration only. A trader with an $8,000 account risks 1% per trade and wins nine in a row at +1R each. Each win adds 1% of the current balance:
8,000 × 1.01⁹ ≈ $8,749.48
On the tenth trade, the trader removes the stop to “give it room” and the loss reaches 10% of the account:
8,749.48 × 0.90 ≈ $7,874.53
That’s 1.57% below the starting balance. Nine rule-following wins were erased by one trade carrying ten times the planned risk. The strategy didn’t fail here. The rule did.
The pull to hold on and hope is predictable, and the guide on how emotions affect trading decisions explains why it hits hardest right after a run of wins or losses. A hard stop placed with your broker takes the decision out of your hands at the moment your judgment is weakest.
Why You Can’t Judge an Edge From Thirty Trades
This is a hypothetical example for illustration only. Suppose a system wins 45% of its trades, with winners averaging 1.5R and losers 1R:
(0.45 × 1.5) − (0.55 × 1) = 0.675 − 0.55 = +0.125R per trade
Over 30 trades, you’d expect 13.5 wins on average. But individual samples scatter. The standard deviation, a measure of typical spread around that average, is about 2.7 wins (√(30 × 0.45 × 0.55)). Treating each trade as independent with a fixed win rate, roughly two-thirds of 30-trade samples would land between 11 and 16 wins, and about 95% between 8 and 19.
Convert the edges of that range into results:
- 8 wins, 22 losses: (8 × 1.5) − 22 = −10R
- 19 wins, 11 losses: (19 × 1.5) − 11 = +17.5R
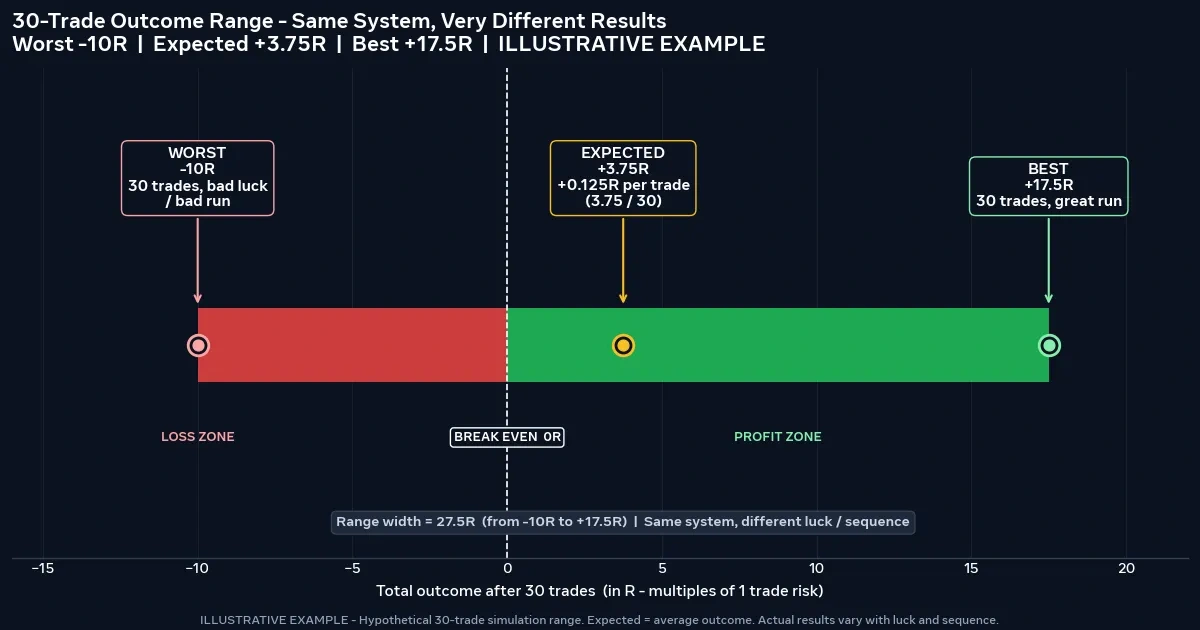
The same system, with nothing changed, can show anything from a painful month to an excellent one. Real markets don’t promise a fixed win rate either, so the true spread is probably wider than this tidy model suggests.
That’s the practical case for risk limits. You can’t tell a sound system from an unsound one early, and a trader risking 5% per trade may be out of capital before the sample is large enough to say anything. Small fixed risk is how you stay in the game long enough to collect evidence.
Six Losses in a Row at 1%, 2%, 5%, and 10%
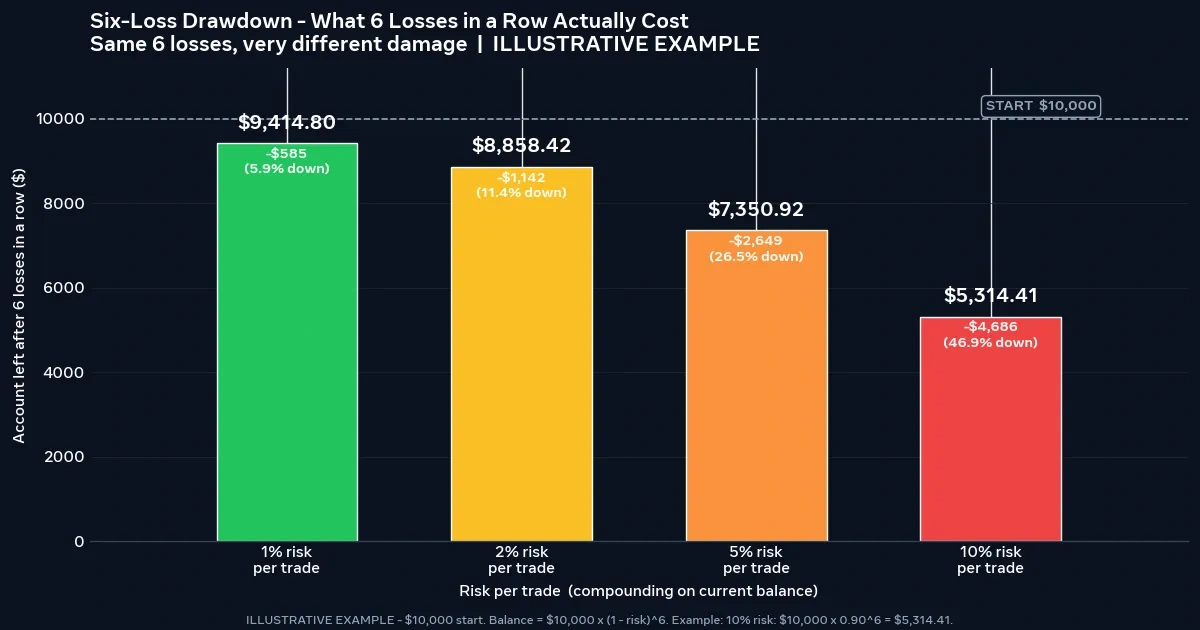
With a 45% win rate, any given trade loses 55% of the time. Six losses in a row has a probability of 0.55⁶ ≈ 2.8% on any particular run of six trades. That sounds rare, but across hundreds of trades such streaks turn up, so plan for them instead of treating them as bad luck.
This is a hypothetical example for illustration only. Starting from $10,000 and risking a fixed percentage of the current balance on each trade:
| Risk per trade | Balance after six losses | Drawdown | Gain needed to recover |
|---|---|---|---|
| 1% | $9,415 | 5.85% | 6.22% |
| 2% | $8,858 | 11.42% | 12.89% |
| 5% | $7,351 | 26.49% | 36.04% |
| 10% | $5,314 | 46.86% | 88.17% |
The recovery column uses gain needed = loss ÷ (1 − loss). The damage is not linear. The 1% trader needs a modest bounce, while the 10% trader needs to nearly double what’s left.
How to turn a risk percentage into an actual lot size, using your stop distance and pip value, is walked through in the forex risk management complete guide. The short version is that you place the stop where the idea is wrong first, then size the position to fit it.
The Decisions an Entry Signal Can’t Make for You
A strategy answers a narrow set of questions. Everything else falls to your risk rules:
| Question | Who answers it |
|---|---|
| Where do I enter? | The strategy |
| Where is the idea proven wrong? | The strategy’s logic, set as a stop |
| How much do I lose if I’m wrong? | Position size |
| How much can be open at once? | A cap on combined exposure |
| When do I stop for the day or week? | Pre-written loss limits |
| What changes after a long losing run? | A drawdown rule written in advance |
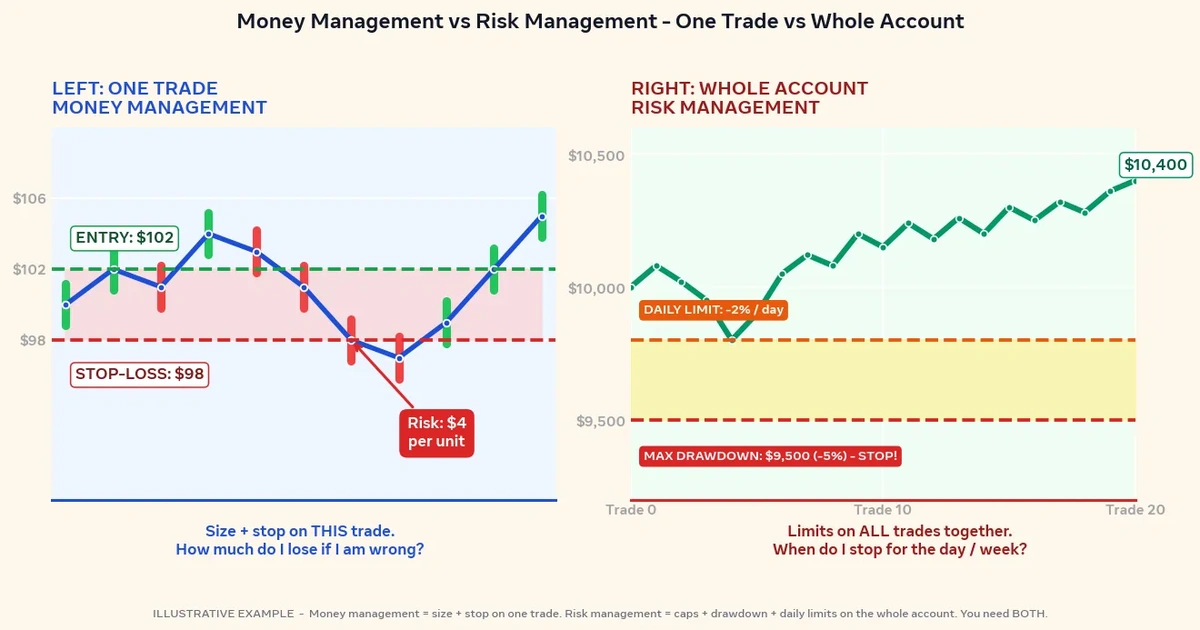
The last four rows are the ones that decide whether a bad month is survivable, and no indicator fills them in. People often use “money management” and “risk management” interchangeably. The two overlap, and money management vs risk management lays out where the distinction lies.
Small Risk Can’t Rescue a Negative Edge
None of this means risk rules replace a strategy. This is a hypothetical example for illustration only. Imagine a system with an expectancy of −0.10R per trade before costs. At 1% risk per trade, 200 trades lose about 20R in total, a drawdown of roughly 18% to 20% depending on how you compound it.
Careful sizing made that loss slow instead of fast. It didn’t make it profitable. A strategy still has to show a positive expectancy in a fair test, and a demo account plus a journal that records every result in R is how most traders find out. Risk management protects the account while the strategy proves itself, or fails to.
The Strategy-Hopping Trap After a Drawdown
A common sequence goes like this. A trader hits six losses, concludes the system is broken, and switches to a new one. The new one hits a rough patch within its first twenty trades, and the trader switches again.
The problem is that every switch resets the sample to zero. A streak of six losses is within normal variance for the 45% system above, so abandoning it may mean abandoning something that was working as designed. Another system’s first twenty trades tell you almost nothing, so the trader is always judging on noise.
The psychological side of this loop, including why it feels so logical in the moment, is covered in why most traders fail. A workable counter is a review rule set before trading: for example, evaluate the system after a fixed number of trades, or when drawdown passes the worst figure seen in your own testing. Changing strategy mid-streak, on feeling alone, is the habit to avoid.
Setting Risk Rules Before Choosing a Strategy: A Short Routine
Run this before you commit to any new system:
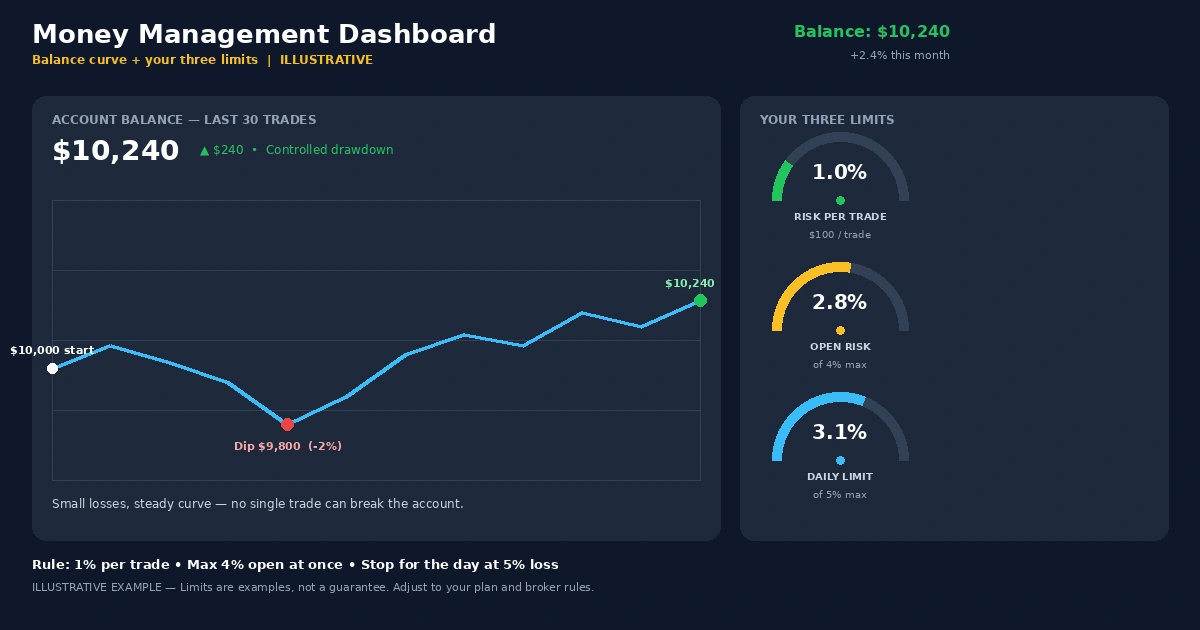
- Fix a per-trade risk. Many traders use a low single-digit percentage or less. The right level depends on your strategy, account size, and tolerance for drawdowns.
- Cap open risk. Count tightly correlated pairs as one position, so three dollar-weakness trades don’t hide as three separate bets.
- Write your stops for the day, week, and drawdown. For instance, a daily loss limit, a weekly one, and a size reduction after a set drop from peak.
- Test the strategy on a demo account. Log every trade in R, including the ones you skipped and why.
- Review on a schedule. Change rules on review days, not in the middle of a losing run.
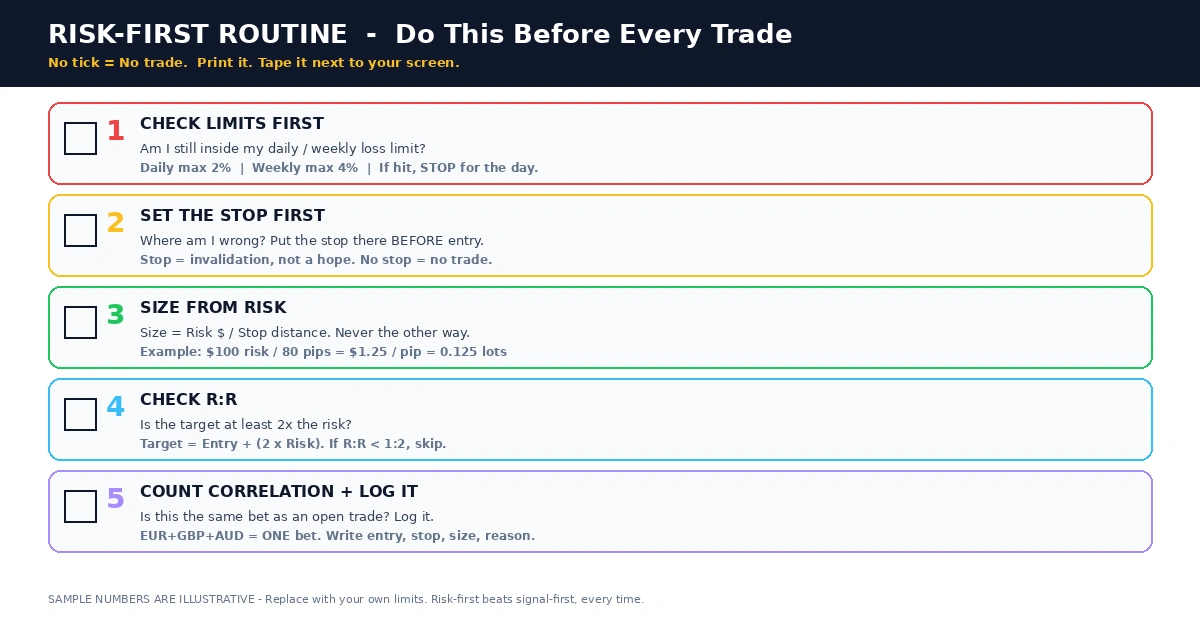
The order matters. Rules first means the strategy gets tested inside a structure that limits the damage if it fails.
Beliefs That Keep Traders Hunting for a Better Strategy
- “A higher win rate means a better system.” The 70% row in the first table shows otherwise. Check payoff and costs before judging.
- “One more indicator will filter out the losers.” Extra filters usually cut trade count and add conflicting signals, but they rarely fix oversized losses.
- “I’ll size up to make it back.” Larger size after a loss makes the next drawdown deeper, as the six-loss table shows.
- “I like this one more, so I’ll risk more.” Conviction isn’t evidence. Size by your stop and your rule, not by how the chart feels.
- “Last week’s results prove the system.” Thirty trades can span −10R to +17.5R on the same edge.
- “The stop is the problem, so I’ll widen it.” A stop that keeps getting hit may be badly placed, which is a fair thing to test. Widening it after entry is a different act, and it’s how planned losses become unplanned ones.
Limits of Careful Sizing: Gaps, Slippage, and the Slow Bleed
Risk rules reduce losses. They don’t remove them, and some risks sit outside the rules.
Gaps and slippage. A stop order becomes a market order once price reaches it, so it fills at the next available price, which can be worse than planned. Weekend gaps and major news releases can jump past your stop, so a loss can exceed the 1R you intended.
Leverage. Leverage lets you control a position much larger than your deposit, and it magnifies gains and losses alike. A trader can lose some or all of the capital in the account. Margin rules and stop-out levels vary by broker and country, so read your own account terms.
Costs that outlast the math. As the first table showed, 0.05R of friction per trade can turn a thin positive edge into a flat one.
Unstable statistics. The R-multiple math here assumes a win rate and payoff that hold steady. Markets shift between trending and ranging conditions, and live results often look worse than backtests because execution adds slippage and emotion.
Counterparty risk. Broker solvency, execution quality, and platform outages are outside your control. Rules for client protection differ by country, so check your local regulator.
Doubts Traders Raise When Told to Focus on Risk First
Is risk management really more important than strategy?
They do different jobs, and neither works alone. A strategy needs a positive expectancy to be worth trading, but risk rules decide whether you survive long enough to find that out. In practice, a mediocre entry method with controlled losses often outlasts a sharp one with uncontrolled sizing.
Can good risk management make a losing strategy profitable?
No. Sizing and stops change how fast an account moves, not whether the underlying expectancy is positive. A system with a negative edge loses more slowly at 1% risk than at 5%, but it still loses. Test the strategy itself on a demo account.
How many trades do I need before judging a strategy?
There’s no fixed number, but 30 trades is thin. The same hypothetical 45% system could print anywhere from −10R to +17.5R over that span. Larger samples narrow the noise, and a live trial on demo or small size adds slippage and your own behavior.
What does 1R mean?
R is the amount you planned to lose on a trade if the stop is hit. If you risk $60, then 1R is $60, a $120 gain is +2R, and a stopped-out trade is −1R. Recording results in R lets you compare trades across different pairs and account sizes.
Should I change strategy after a losing streak?
Not on feeling alone. Compare the streak to the worst run in your own testing and to the review rule you wrote beforehand. If the drawdown is within that range, it may be normal variance. If it’s beyond it, or if you’ve been breaking rules, fix that first.
The Setup Is a Guess; the Size Is a Decision
Your entry can be wrong on any trade, and no strategy changes that. What you control is how much each wrong guess costs, whether one lapse can erase weeks of work, and whether a streak ends your trading or just dents it. For your next step, take your last 20 closed trades and convert each result into R. If any loss lands near −2R or worse, you’ve found a rule problem, and it’s worth fixing before touching the strategy.
Disclaimer
This article is for educational purposes only and is not financial advice. Forex and CFD trading involves a high level of risk, and you can lose some or all of your capital. Leverage can magnify both gains and losses. Never trade with money you can’t afford to lose.
This is educational content, not personalized investment advice. Your financial situation, goals, and local regulations are different, so consider speaking with a licensed financial professional before making decisions.
Any percentages or figures shown are historical averages or hypothetical examples, not guarantees. Past performance does not predict future results.
Join now
Comments (0)
Be the first to comment.