
20 and 50 EMA Crossover Trading Strategy
Twenty candles is a short memory, and fifty is a long one. The 20 and 50 EMA crossover strategy watches for the moment the short memory overtakes the long one, and treats that as a hint that a trend may be starting. It’s popular because it’s visible, simple to write down, and easy to test. It’s also easy to misuse, because the cross arrives late and sometimes arrives falsely. Below are the mechanics, entry and stop rules, a fully priced hypothetical trade, the break-even arithmetic, and an honest look at where the system loses money.
Reading the 20/50 Cross Before You Risk Anything
- An EMA (exponential moving average) is an average of closing prices that weights recent candles more heavily than old ones.
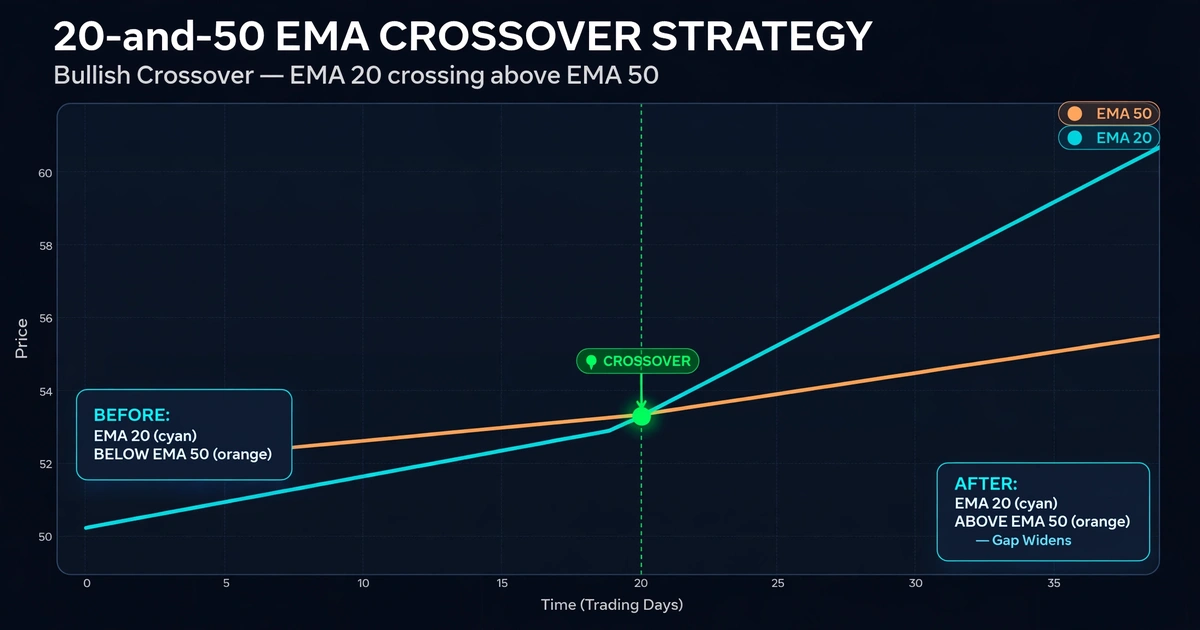
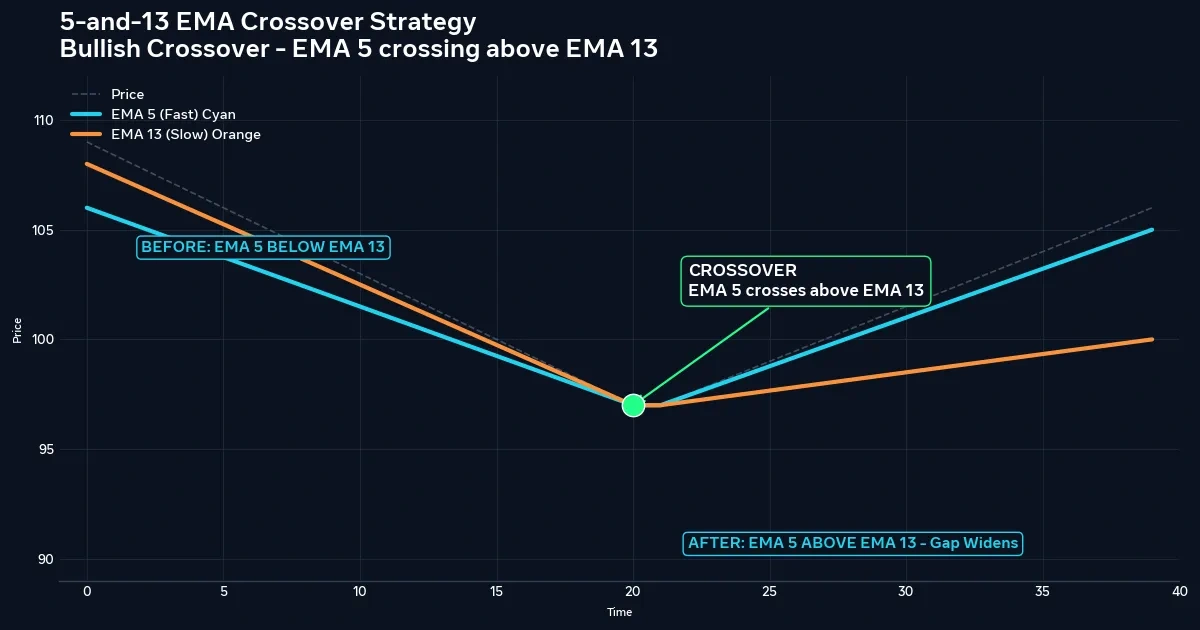
- A bullish cross is the 20 EMA closing above the 50 EMA. A bearish cross is the reverse.
- Many traders treat the cross as a sign that a trend may be changing, then place a stop beyond a recent swing point and exit on a target or the opposite cross.
- The system tends to suit sustained trends and tends to struggle in ranges. Neither is guaranteed.
Why an EMA Turns Sooner Than a Simple Average
A simple average gives every candle in its window equal weight. An EMA multiplies the newest close by a smoothing factor and blends in the previous EMA value:
EMA today = EMA yesterday + k × (Close today − EMA yesterday), where k = 2 ÷ (N + 1)
For the 20 EMA, k = 2 ÷ 21, about 0.0952, so each new close carries roughly 9.5% of the weight. For the 50 EMA, k = 2 ÷ 51, about 0.0392, or roughly 3.9%.
A quick illustration: if yesterday’s 20 EMA was 149.50 and today’s close is 150.00, the new value is 149.50 + 0.0952 × 0.50 = 149.5476. The line moved less than five hundredths of a point on a half-point jump, which shows how much smoothing is still happening.
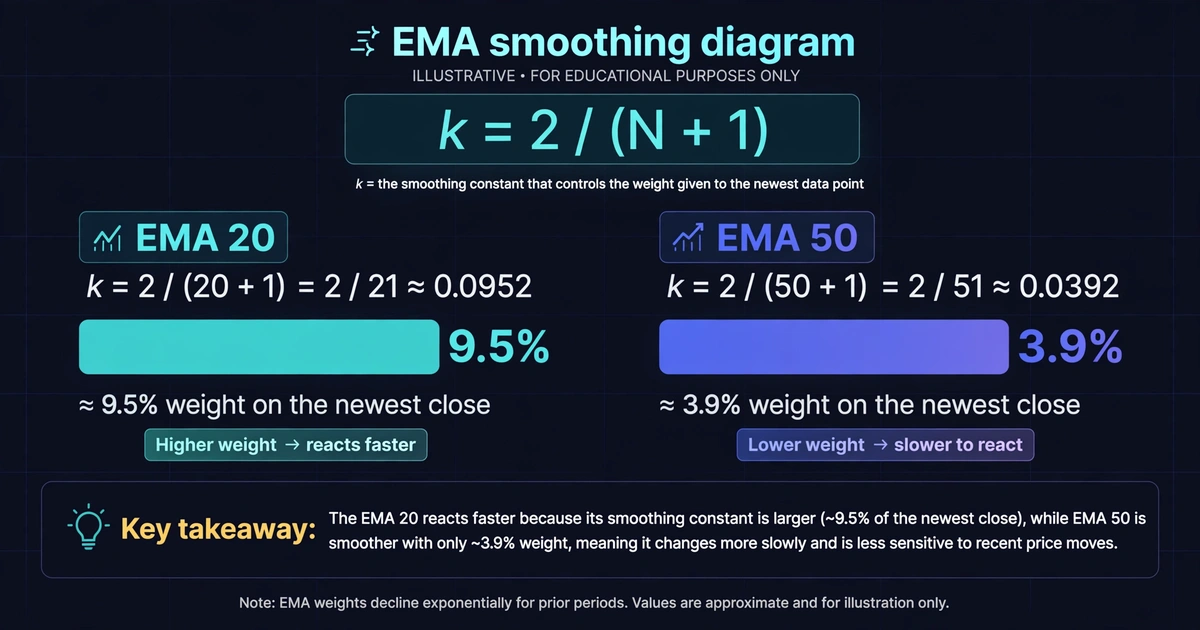
Because recent closes count for more, an EMA tends to turn sooner after a sharp move than a simple average of the same length. It still lags, though, and older candles never fully drop out of the calculation. Faster turns mean earlier signals but also more false ones. If you want to compare with the equal-weighted version, the 10 and 50 moving average crossover strategy covers how simple averages behave.
What 20 and 50 Candles Mean on Each Chart
The same two numbers describe very different stretches of time depending on the chart.
| Chart | 20 candles span | 50 candles span | Typical character |
|---|---|---|---|
| 15-minute | 5 hours | 12.5 hours | Many crosses, costs weigh heavily |
| 1-hour | 20 hours | 50 hours | A few signals per week on active pairs |
| 4-hour | About 3.3 days | About 8.3 days | Slower signals, wider stops |
| Daily | 4 trading weeks | 10 trading weeks | Rare signals, large stops, swap matters |
These spans are approximate because EMA weights aren’t equal. The pattern holds regardless: short charts give more crosses and more noise, while slow charts give fewer signals that demand patience. Check which chart fits the hours you can actually give before settling on one.
Entry Conditions for a 20/50 EMA Buy or Sell
Treat this as a rule set to test, not a recommendation.
Buy setup
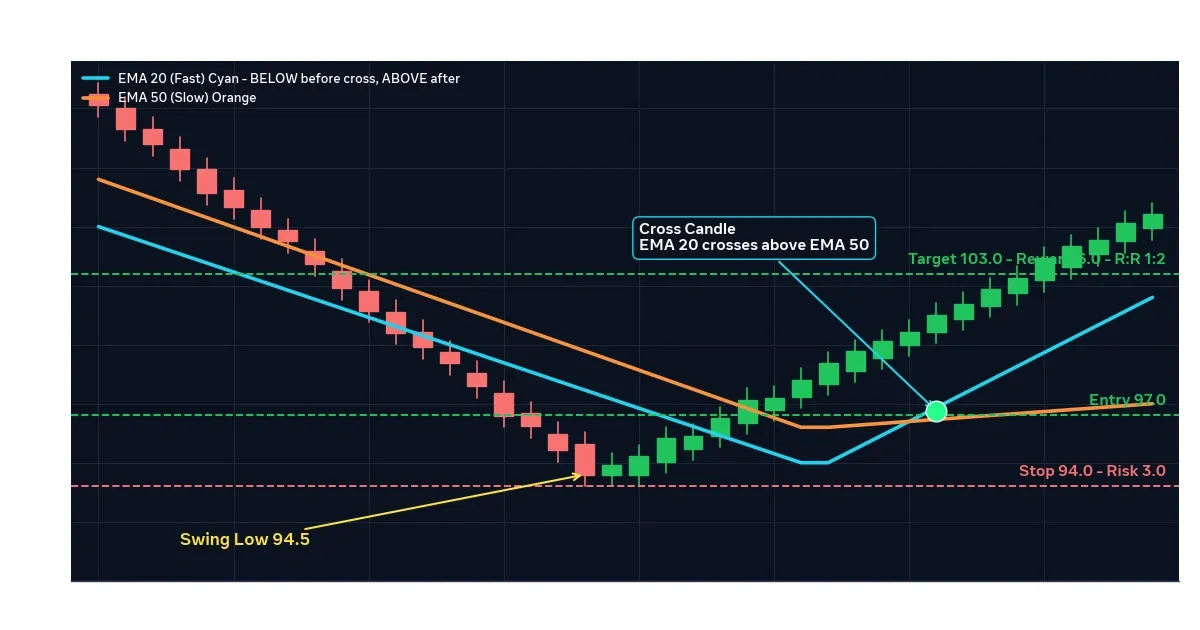
- The 20 EMA closes above the 50 EMA after being below it.
- Wait for the cross candle to close. A cross that appears mid-candle can vanish before the close.
- The 50 EMA should be flat or sloping up, not clearly falling.
- Enter on the next candle’s open, or wait for a pullback toward the 20 EMA and accept that you may miss the move.
Sell setup
- The mirror image: the 20 closes below the 50, confirmed on a closed candle, with the 50 flat or sloping down.
Skip the signal if
- The two lines are tangled and crossing back and forth every few candles.
- Price is already stretched far from the 50, which suggests the cross is late.
This is trend-following logic, the same idea laid out in trend following strategy for beginners: you join a move that has begun and accept that you will miss the start of it.
Pullbacks to the 20 EMA: A Second Way In
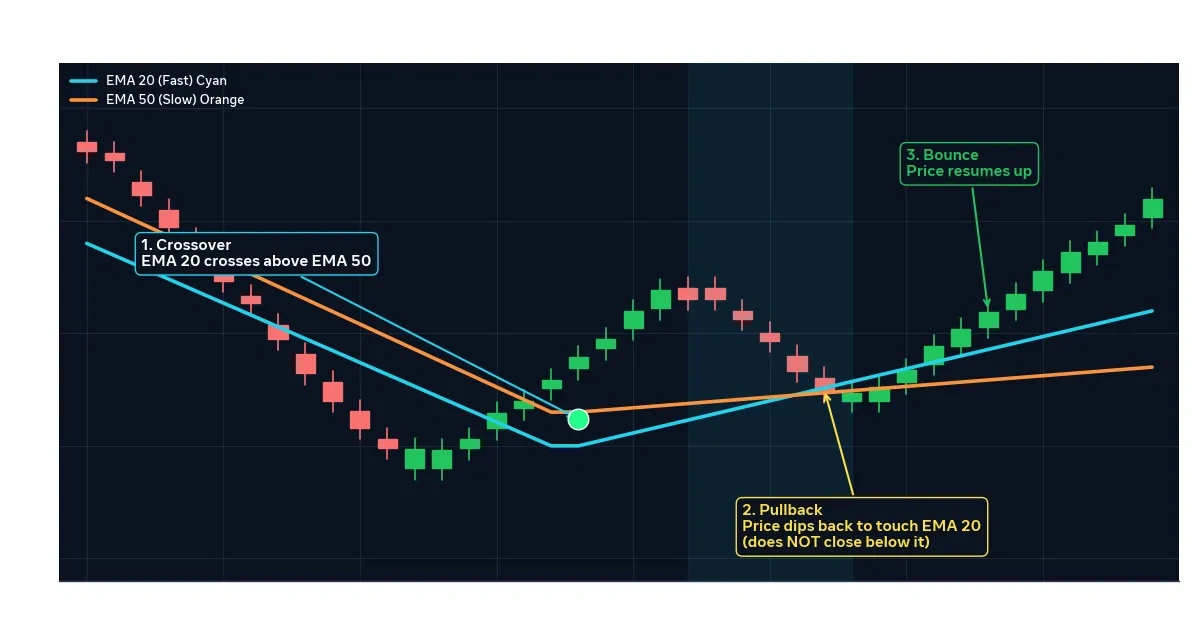
Some traders use the cross only as a direction filter and enter later, on a pullback. After a bullish cross, they wait for price to dip back to the 20 EMA and form a bullish candle there. The logic is that the fast line often acts as a loose dynamic support zone while a trend is intact.
The trade-off is plain. You get a better price and a closer stop, but you may wait for a pullback that never comes, and a pullback that slices through the 20 and the 50 is a warning that the trend has failed. Choose either the cross entry or the pullback entry for a test, not both, so you can tell which rule is producing results.
Stop Placement and Exit Choices for EMA Trades
Two common stop placements:
- Beyond the last swing point. For a buy, below the most recent swing low before the cross.
- A volatility multiple. For example, 1.5 times the average true range (ATR, the average candle range over a period), which adjusts to current conditions.
Two common exits:
- A fixed reward-to-risk target, such as 2 times the stop distance.
- The opposite cross. This lets winners run, but it returns a large share of open profit before it triggers because of lag.
Use one exit method per test. Mixing targets and opposite-cross exits makes it impossible to tell which rule is helping. And never rely on the opposite cross as your only protection, since a hard stop-loss order caps the damage from a sudden move, though it can’t promise a fill at your price.
Telling a Real Crossover From a Wiggle
A whipsaw is a cross that reverses soon after it appears and stops you out. Filters try to screen some of these out.
- Slope of the 50 EMA. A nearly horizontal slow line suggests no trend to follow.
- Gap between the lines. Some traders want a visible separation after the cross, not a hair’s-width touch.
- Higher-timeframe direction. Take buys on the 1-hour only when the daily chart is also trending up, for example.
- A trend-strength reading. The ADX indicator is one option, with readings above roughly 20 to 25 commonly treated as trending. That threshold is a convention, not a rule of nature.
Every filter removes some good trades along with the bad ones. Keep a filter only if your journal shows it improved results after costs.
A Hypothetical USD/JPY Long, Priced to the Cent
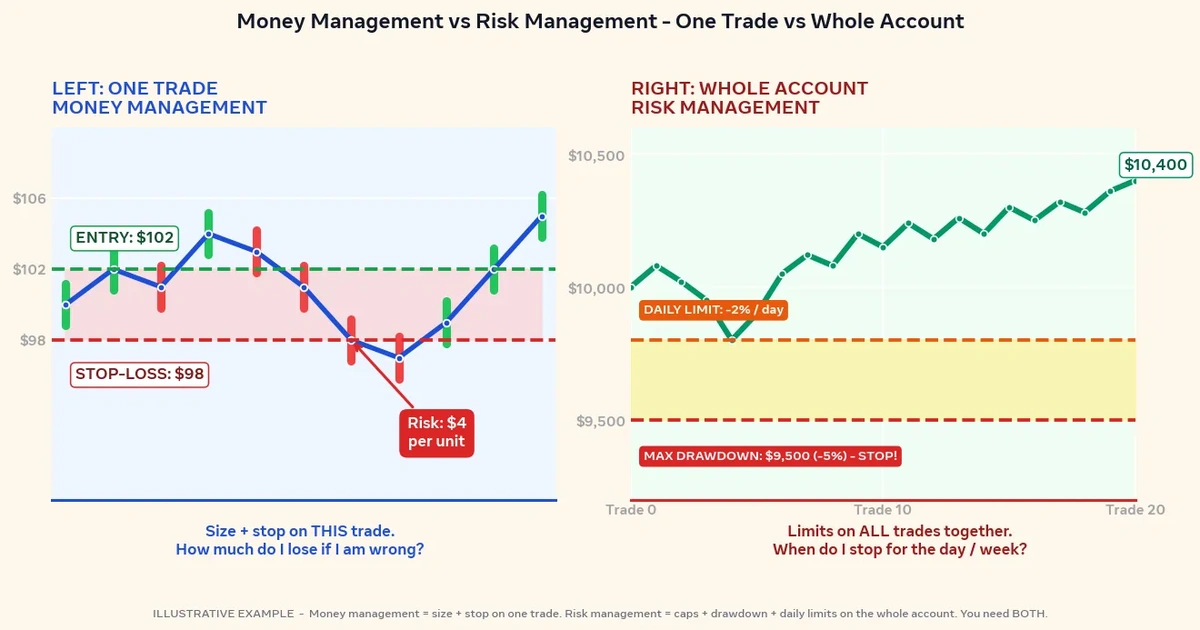
Assume a $3,000 account risking 1% ($30) per trade. For simplicity, assume USD/JPY trades near 150.00. One pip is 0.01, so a standard lot (100,000 units) moves ¥1,000 per pip, which is about $6.67 at that rate. Pip value in dollars shifts as the exchange rate moves.
On the 1-hour chart, the 20 EMA closes above the 50 EMA, and the 50 is sloping up. A trader buys at 149.80, puts a stop at 149.30 beneath the last swing low, and sets a target at 150.80.
- Stop distance: 50 pips. Target distance: 100 pips. Reward-to-risk is 2:1.
- Position size: $30 ÷ (50 × $6.67) = 0.09 lots, where one pip is about $0.60.
- Spread of 1.0 pip costs about $0.60. No commission or swap is assumed.
- If the target is hit: 100 × $0.60 = $60.00, minus $0.60, leaves about $59.40.
- If the stop is hit: 50 × $0.60 = $30.00, plus $0.60, is a loss of about $30.60.
This is a hypothetical example for illustration only. Prices and costs are invented, real fills differ, and a gap past the stop would produce a larger loss than $30.60.
How Often Must the Cross Win? The Break-Even Arithmetic
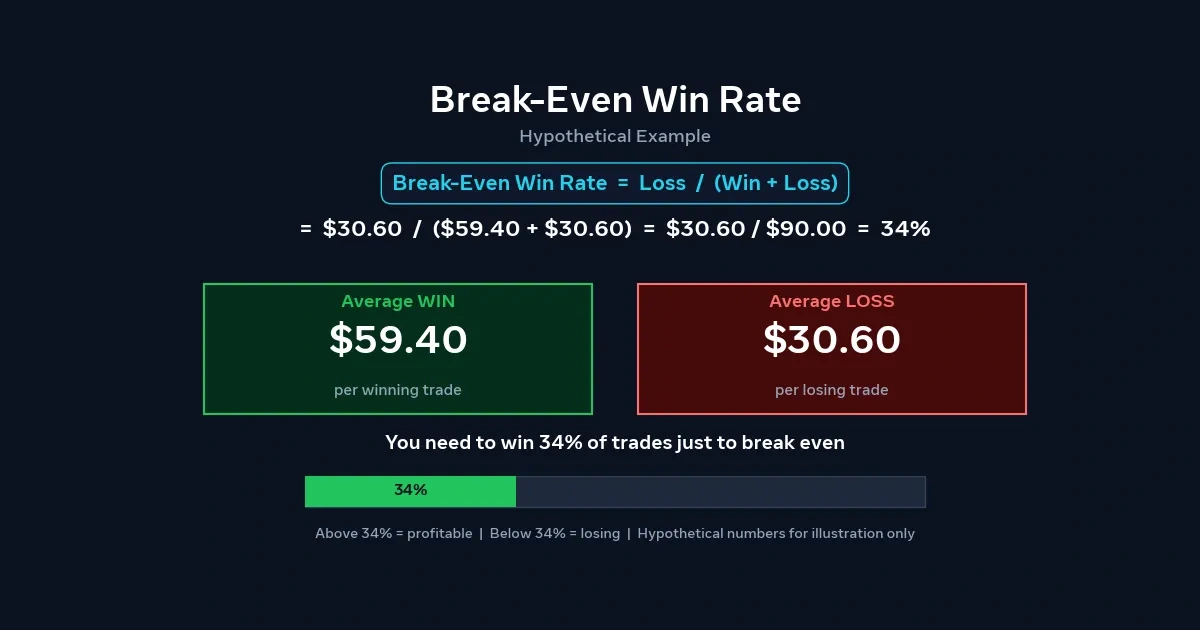
Using the numbers above, a win pays about $59.40 and a loss costs about $30.60. Break-even win rate equals the loss divided by the sum of loss and win:
$30.60 ÷ ($30.60 + $59.40) = 0.34, or 34%.
So in this hypothetical setup, the system would need to win roughly one trade in three just to cover its costs, before any profit. That is a calculation, not a forecast. Nobody can say what win rate a particular crossover will produce in live markets, and it changes with conditions.
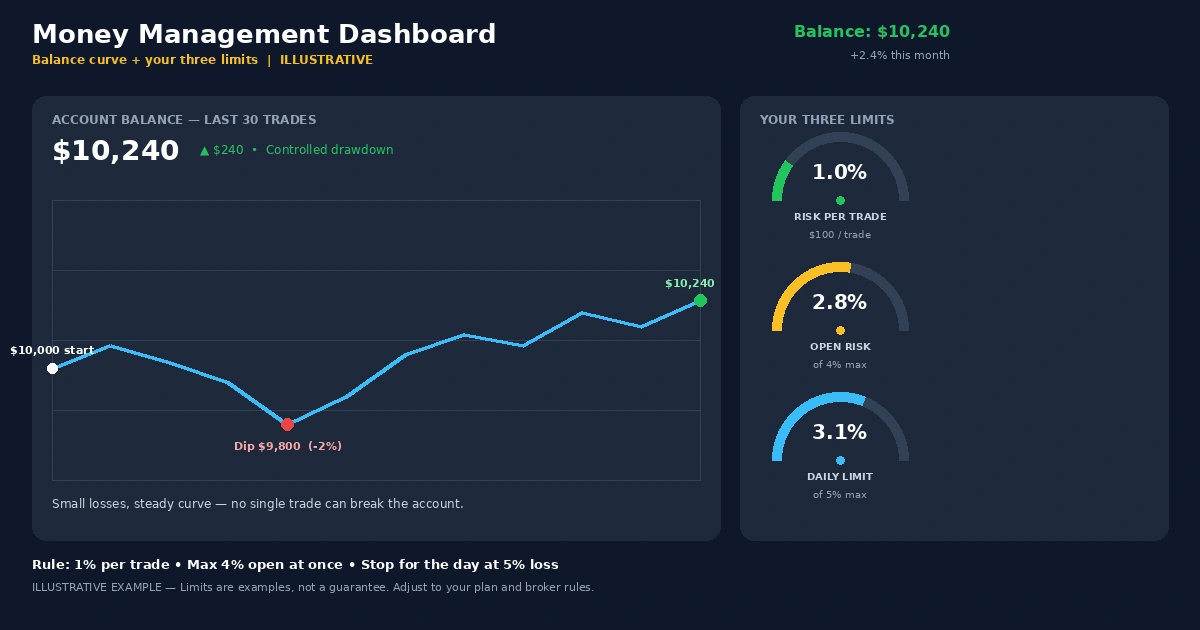
The second lesson is about streaks. Six losses in a row at $30.60 each is about $184, roughly 6% of the account. A trend system accepts runs of small losses and relies on occasional larger winners, and some traders can’t sit through that. If a six-trade losing run would make you abandon the rules, size smaller or choose a different approach.
20/50 EMA Against Its Neighbors
| Pair | Speed | Signal frequency | Main trade-off |
|---|---|---|---|
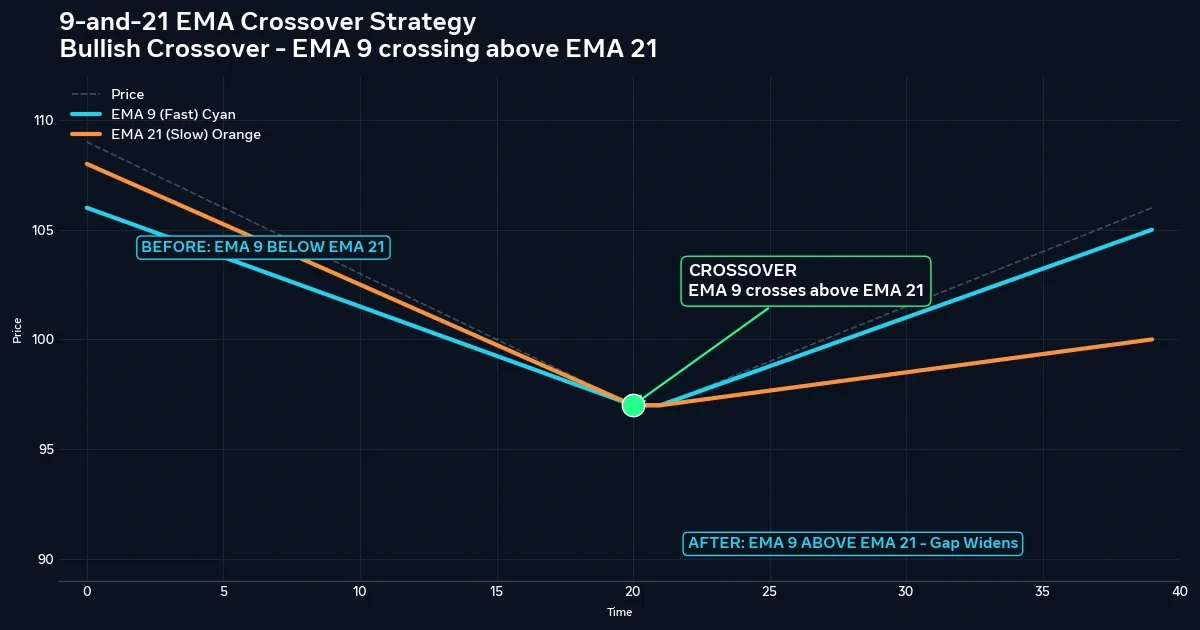
| 9 and 21 EMA | Faster | Higher | Earlier entries, more false crosses |
| 20 and 50 EMA | Medium | Moderate | Balanced, but still lags and whipsaws |
| 10 and 50 SMA | Medium, smoother | Moderate | Smoother line, slower turns |
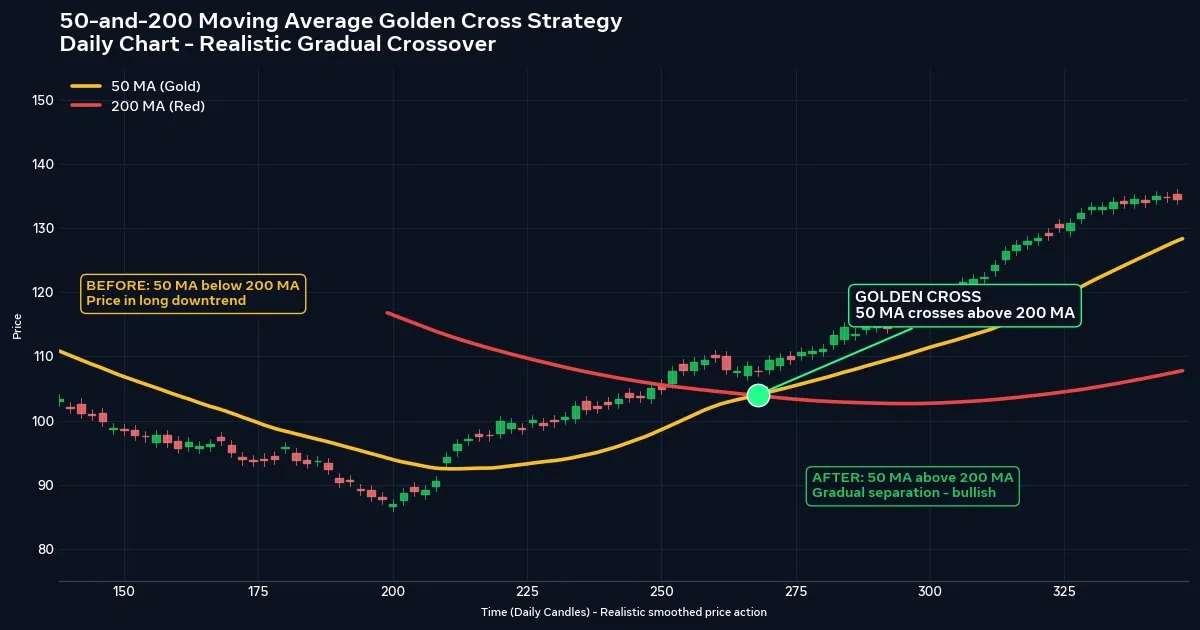
| 50 and 200 averages | Slow | Rare | Few signals, very late entries |
No pair is universally better. A faster pair buys speed with noise, and a slower pair buys calm with lag. Pick one, fix the settings, and test with costs included.
Misusing the 20/50 Cross: Errors Worth Removing Early
- Acting before the candle closes. Mid-candle crosses often disappear.
- Retuning after a bad week. Moving from 20/50 to 18/45 to 25/55 fits the past and tells you little about the future.
- Trading every cross on every pair. A trend system on a range-bound pair collects stop-outs.
- Ignoring spread on short charts. Frequent crosses mean frequent costs.
- Adding to losers after a cross fails. Extra positions multiply exposure beyond your risk plan.
- Reading the cross as a forecast. It describes what already happened. It doesn’t promise what comes next.
Traders Who Will Probably Dislike This System
Consider skipping it, or adjusting expectations, if you:
- want entries near the exact turning point, since crossovers confirm after the fact;
- can’t tolerate several small losses in a row without changing the rules;
- only trade pairs or periods that move sideways most of the time;
- expect a high win rate, when trend systems often depend on the size of winners instead.
What Can Go Wrong When an EMA Cross Fails
Lag. The cross confirms a move already in progress. Entries come after part of it is gone, and opposite-cross exits hand back open profit.
Whipsaws. In choppy conditions the lines cross repeatedly. Each failed trade costs the stop distance plus spread, and the small losses accumulate faster than most beginners expect.
Gaps and slippage. Price can jump past your stop around news or over a weekend. A stop-loss limits loss only when the market fills it near your price.
Leverage. Leverage magnifies losses as well as gains, and a trader can lose the entire deposit. Sizing each trade as a small fixed percentage, as set out in the forex risk management complete guide, keeps one bad run survivable.
Backtest versus live. A backtest can look strong when spread, slippage, and the stress of an open trade are left out. Settings that fit one historical period may fail in the next.
EMA Crossover Questions, Answered Straight
Is the 20 and 50 EMA crossover profitable?
It can be in some market conditions and not in others. Trending markets tend to favor it, while ranges tend to hurt it. Results depend on costs, risk control, and how consistently you follow your rules. No setting guarantees profit, so test it on a demo account first.
Which timeframe suits the 20/50 EMA cross?
No timeframe suits every trader. Shorter charts produce more signals, more noise, and a heavier cost share. Slower charts give fewer signals but need wider stops and more patience. Match the chart to your free hours, then test.
Should I enter on the cross or wait for a pullback?
Both are used. Entering on the cross is simpler but later in the move. Waiting for a pullback to the 20 EMA gives a closer stop but risks missing the trade. Test one at a time and compare results with costs.
How is this different from the 9 and 21 EMA?
The 9/21 pair is faster, so it signals earlier and more often, with more false crosses. The 20/50 is smoother and slower. Neither is correct in the abstract, and the choice depends on your timeframe and tolerance for noise.
Does the 20/50 EMA work for gold or indices?
The mechanics are identical, but spreads, volatility, and gaps differ by market. Confirm how costs and overnight moves work in the instrument you trade, and test it separately before assuming results carry over.
The Cross Is the Easy Part
Spotting the 20 EMA crossing the 50 takes a glance. The hard parts are what surrounds it: waiting for the close, sizing the position from the stop, sitting through a run of small losses, and not rewriting the rules after a bad week. The lines only describe where price has been.
For your next step, open a 1-hour chart on a demo account, mark the last twenty crosses by hand, and note which were followed by a sustained move and which reversed within a few candles. That tally will teach you more than any description of the system.
Disclaimer
This article is for educational purposes only and is not financial advice. Forex and CFD trading involves a high level of risk, and you can lose some or all of your capital. Leverage can magnify both gains and losses. Never trade with money you can’t afford to lose.
This is a trading framework, not a guarantee. No strategy wins every trade, and results vary with market conditions, execution, and risk management.
Any percentages or figures shown are historical averages or hypothetical examples, not guarantees. Past performance does not predict future results.
Join now
Comments (0)
Be the first to comment.