
10 and 50 Moving Average Crossover Trading Strategy
Two lines drift toward each other on your chart, the faster one slices through the slower one, and it looks like the market just confirmed your hopes. That is the appeal of the 10 and 50 moving average crossover: a rule you can see, with no guessing about what counts as a signal. It is also a rule that fires late and fires falsely, and the gap between those two facts is where most of the learning happens. Below you’ll find the exact mechanics, a priced-out example, the filters traders add, and an honest look at what a sideways market does to this system.
When the 10 Crosses the 50: Signal, Stop, Exit
- A moving average is the average closing price over the last N candles, redrawn on every new candle.
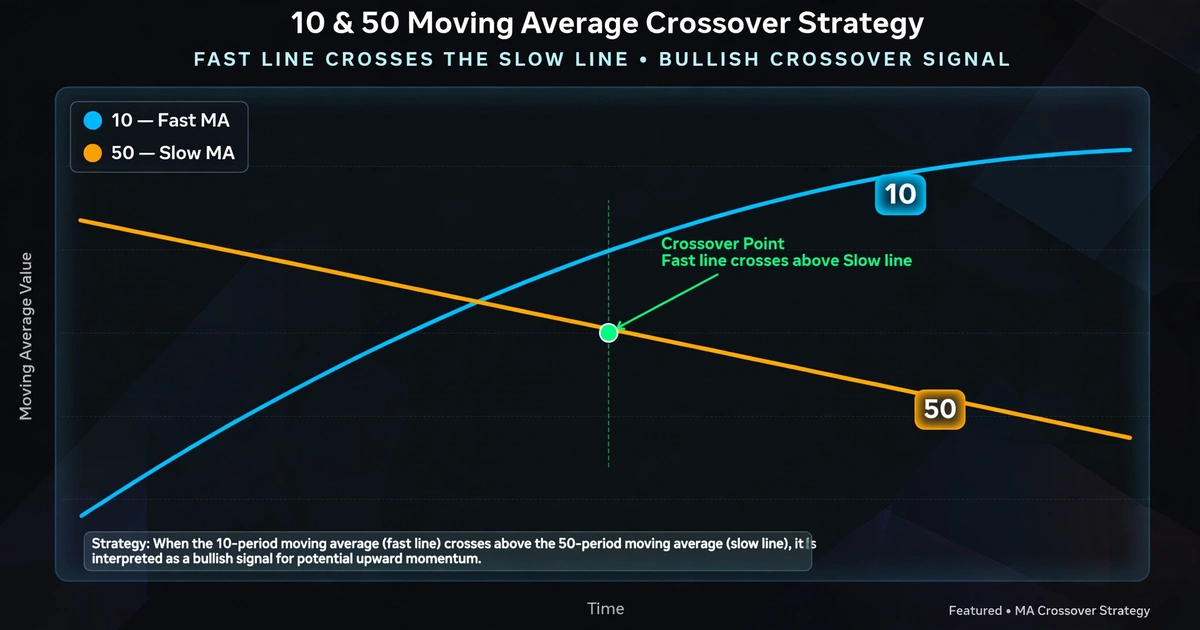
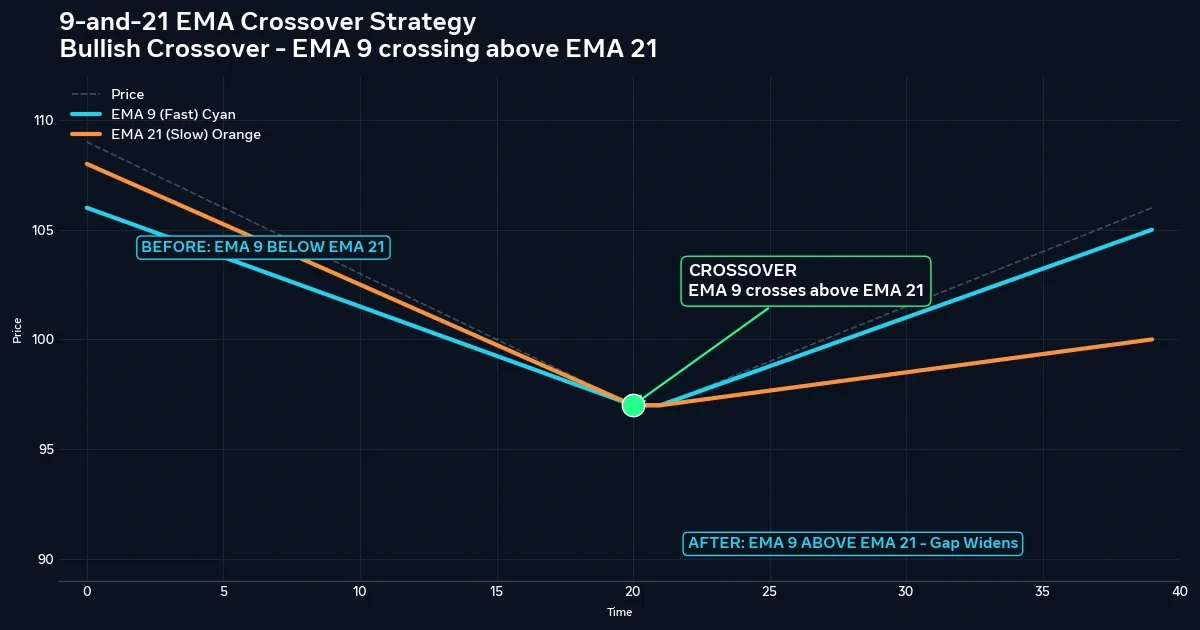
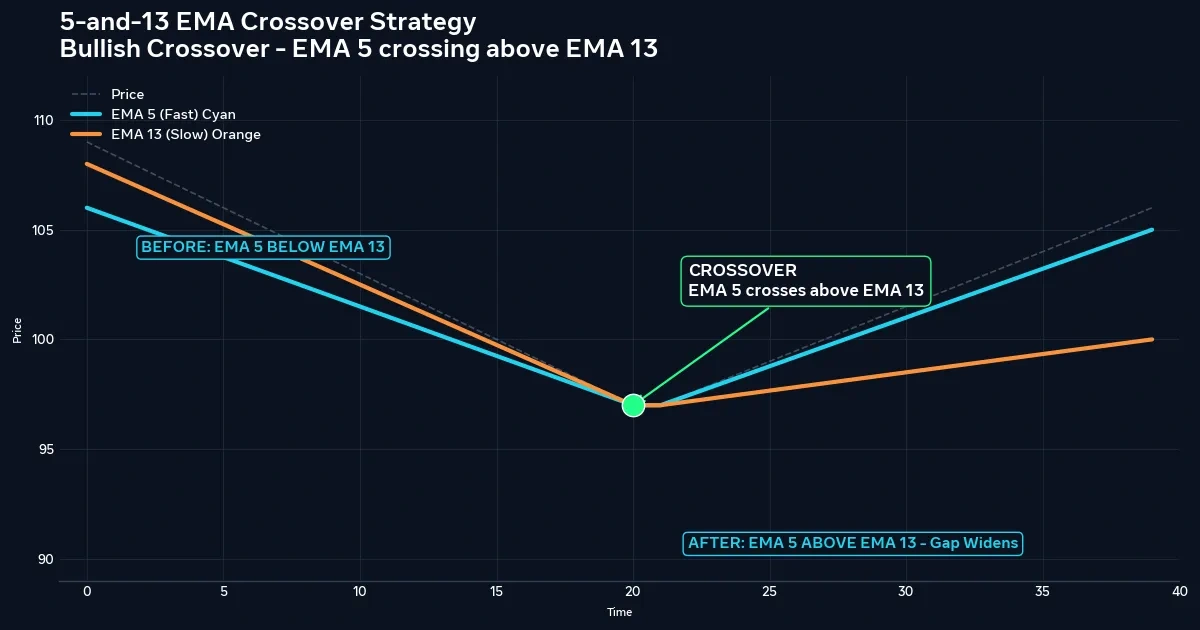
- A bullish cross happens when the 10-period average moves above the 50-period average. A bearish cross is the reverse.
- Many traders treat the cross as a trend-change signal, place a stop beyond a recent swing point, and exit on a fixed target or the opposite cross.
- The system tends to work best in sustained trends and tends to struggle in ranges. There is no guarantee in either case.
How Two Averages Turn Price Into a Signal
A 10-period simple moving average (SMA) adds the last ten closes and divides by ten. The 50-period version does the same over fifty closes. Because the 10 reacts to only ten candles, it follows price closely. The 50 moves slowly and describes the broader drift.
When the fast line crosses above the slow one, recent prices have climbed far enough to pull the short average over the long-term average. That is all the signal says. It does not say price will keep rising.
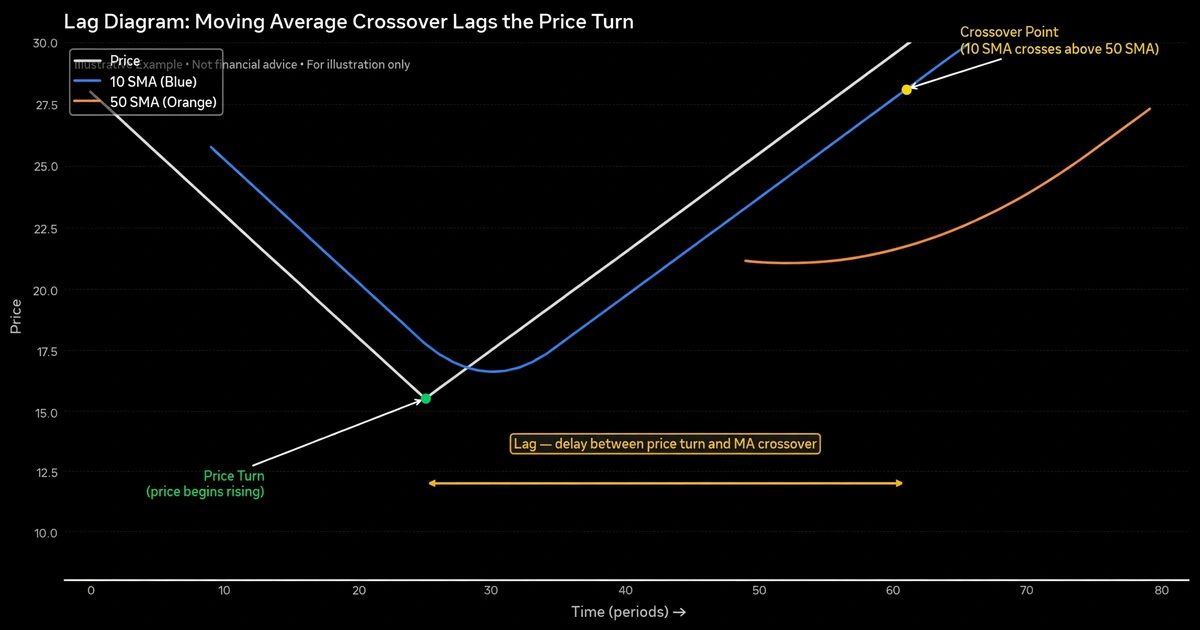
It also arrives late. An equal-weighted average of N closes reflects price from about (N − 1) ÷ 2 candles ago on average. That is roughly 4.5 candles for the 10 and 24.5 candles for the 50. By the time the lines cross, part of the move has often already happened. Lag is the price you pay for a rule that filters out some noise.
Picking SMA or EMA for the 10 and 50
An exponential moving average (EMA) gives more weight to recent closes, so it turns faster than an SMA of the same length. That means earlier signals but also more false ones. The SMA is smoother and slower.
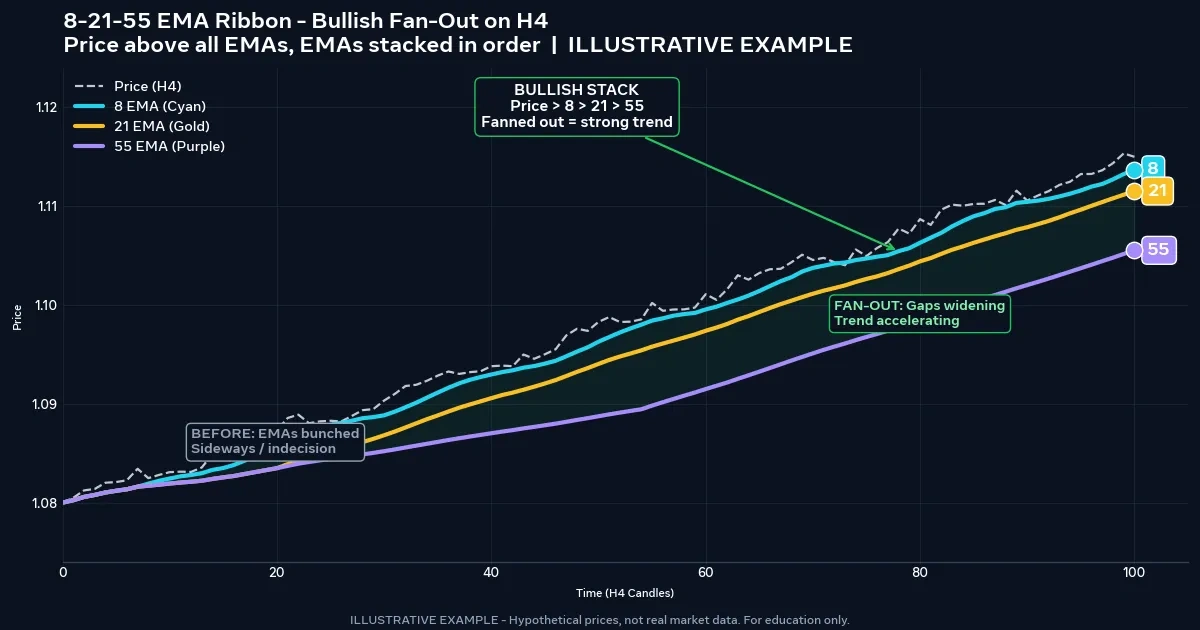
Neither is correct in the abstract. If you prefer a quicker line, the 20 and 50 EMA crossover strategy shows how the exponential version behaves. For this article, assume simple averages calculated on closing prices. Whatever you choose, keep it fixed during testing, because changing the type mid-trial makes your results impossible to compare.
Entry Rules for Buys and Sells on the 10/50 Cross
Here is one rule set. Treat it as a testable starting point, not a recommendation.
Buy setup
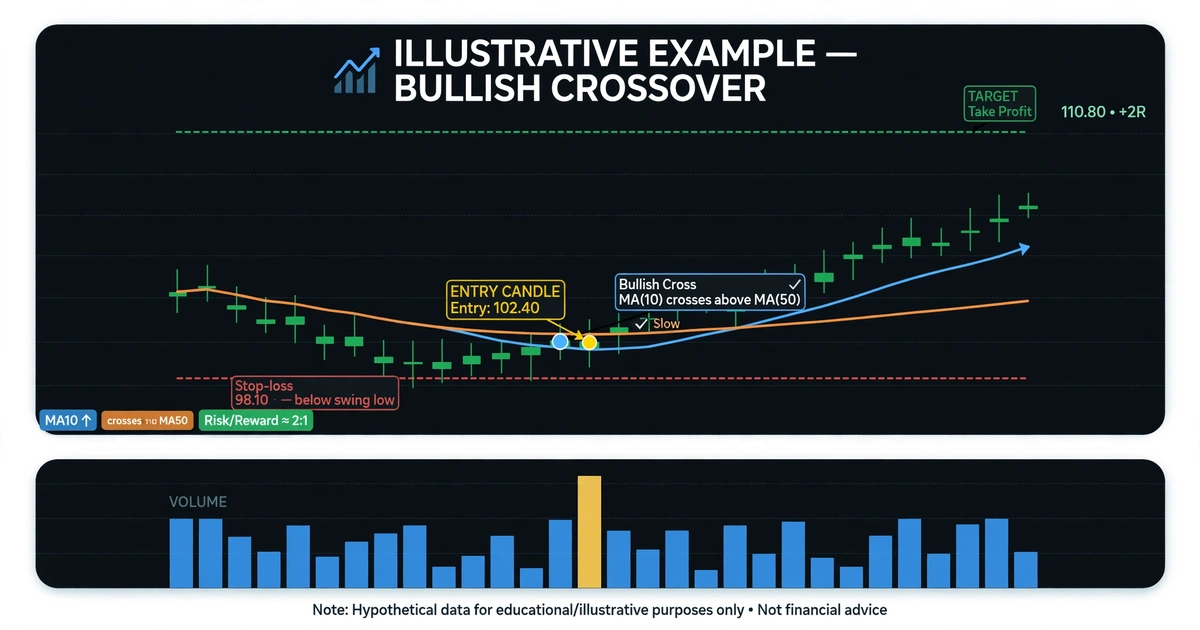
- The 10 SMA closes above the 50 SMA after being below it.
- Wait for the candle that created the cross to close. A cross that appears mid-candle can disappear before the close.
- Enter at the open of the next candle, or on a small pullback toward the 10 SMA if you want a better price and accept that you may miss the move.
Sell setup
- The mirror image: the 10 closes below the 50 after being above it, confirmed on a closed candle.
Skip the signal if
- The 50 SMA is flat. A flat slow line suggests there is no trend to follow.
- Price has just moved a long way from the 50 already. The cross is likely late.
This is the trend-following logic described in trend following strategy for beginners: you are betting that a move in progress continues, not predicting a turn.
Where to Put the Stop and When to Leave
Two common stop placements:
- Beyond the last swing point. For a buy, below the most recent swing low before the cross. This ties the stop to market structure.
- A multiple of volatility. For example, a set multiple of the average candle range (ATR), which adjusts to the current market.
Two common exits:
- A fixed reward-to-risk target, such as twice the stop distance.
- The opposite crossover. This lets winners run but returns a large share of open profit before it triggers, because of lag.
Pick one exit method per test. Using a target on some trades and the opposite cross on others blurs which rule is working.
Filters That Cut Down Crossover Whipsaws
A whipsaw is a cross that reverses soon after it appears, leaving you with a stop-out. Filters try to reduce them, usually by skipping weak signals.
- Slope of the 50. Skip crosses where the 50 SMA is nearly horizontal.
- Distance between the lines. Some traders require a visible gap rather than a hair’s-width cross.
- Higher-timeframe direction. Take buys only when the daily chart is also trending up, for instance.
- Trend-strength readings. Some traders use the ADX indicator, with readings above roughly 20 to 25 treated as a sign of trend. The threshold is a convention, not a law.
Every filter also removes some good trades. A filter is worth keeping only if your journal shows it improved results after costs, and no filter eliminates whipsaws.
Pairing a Timeframe With the 10/50 Cross
The same two numbers behave differently on different charts.
| Timeframe | What the 10/50 represents | Typical character |
|---|---|---|
| 15-minute | About 2.5 hours vs. 12.5 hours of price | Frequent crosses, high cost share, many whipsaws |
| 1-hour | About 10 hours vs. 50 hours | Several signals a week on active pairs |
| 4-hour | About 1.7 days vs. 8.3 days | Fewer, slower signals; wider stops |
| Daily | 2 weeks vs. 10 weeks | Rare signals; large stops; swap matters |
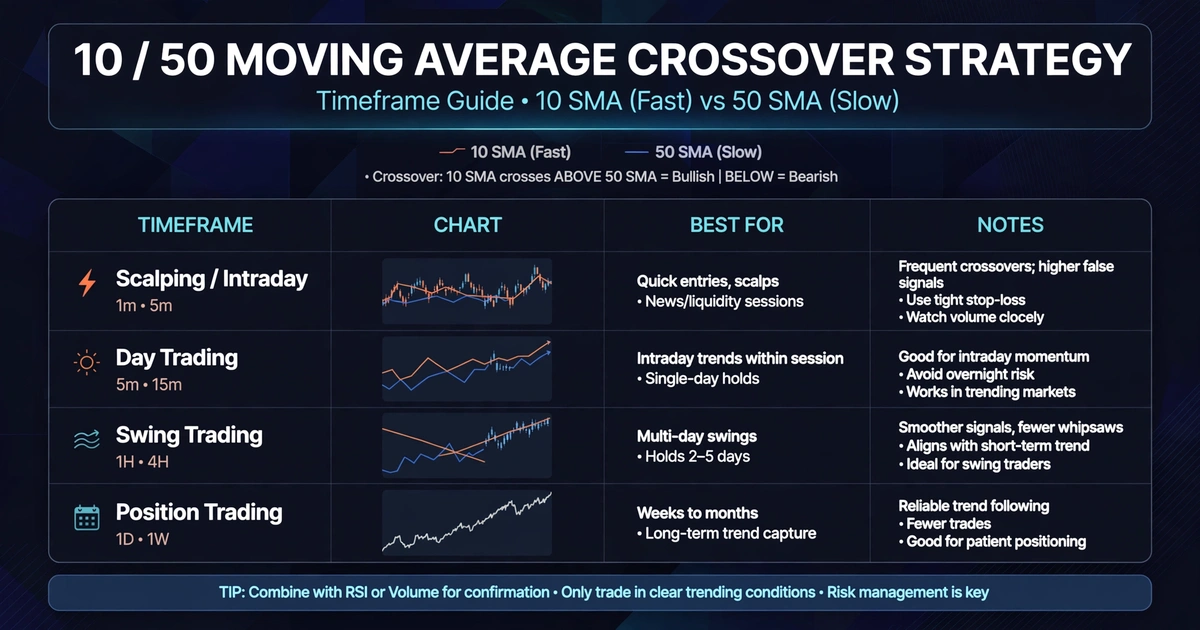
Shorter charts produce more crosses but each one is more likely to be noise, and spread takes a bigger bite of every target. Slower charts cost less per trade but demand wider stops and more patience. Check your free hours against the chart before choosing.
A Hypothetical 4-Hour EUR/USD Cross, Priced Out
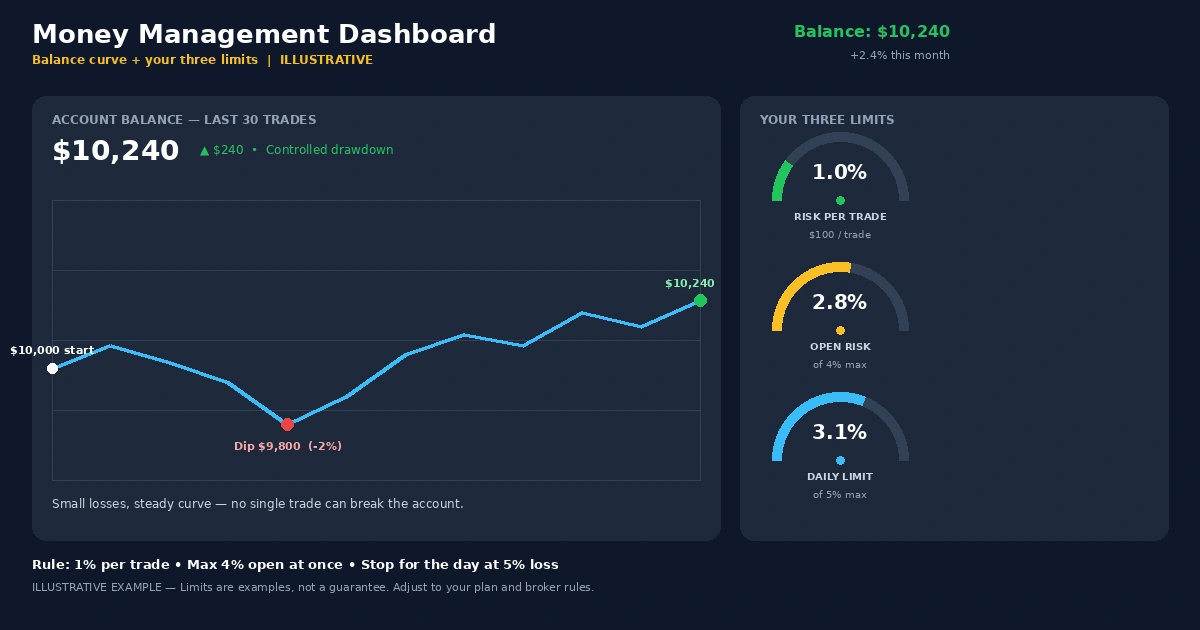
Assume a $5,000 account risking 1% ($50) per trade. On EUR/USD, one pip is about $10 per standard lot. A 1.2-pip spread is the only cost, and there is no commission or swap.
On the 4-hour chart, the 10 SMA closes above the 50 SMA. The 50 is sloping upward. A trader buys at 1.0820, places a stop below the last swing low at 1.0775, and sets a target at 1.0910.
- Stop distance: 1.0820 − 1.0775 = 45 pips.
- Target distance: 1.0910 − 1.0820 = 90 pips, a 2:1 reward-to-risk ratio.
- Position size: $50 ÷ (45 × $10) = 0.111 lots, rounded down to 0.11 lots, where one pip is $1.10.
- Spread cost: 1.2 × $1.10 = $1.32.
- If the target is hit: 90 × $1.10 = $99.00, minus $1.32, leaves $97.68.
- If the stop is hit: 45 × $1.10 = $49.50, plus $1.32, is a loss of $50.82.
This is a hypothetical example for illustration only. Prices are invented, and real fills, spreads, and gaps will differ. A gap through the stop would produce a larger loss than $50.82.
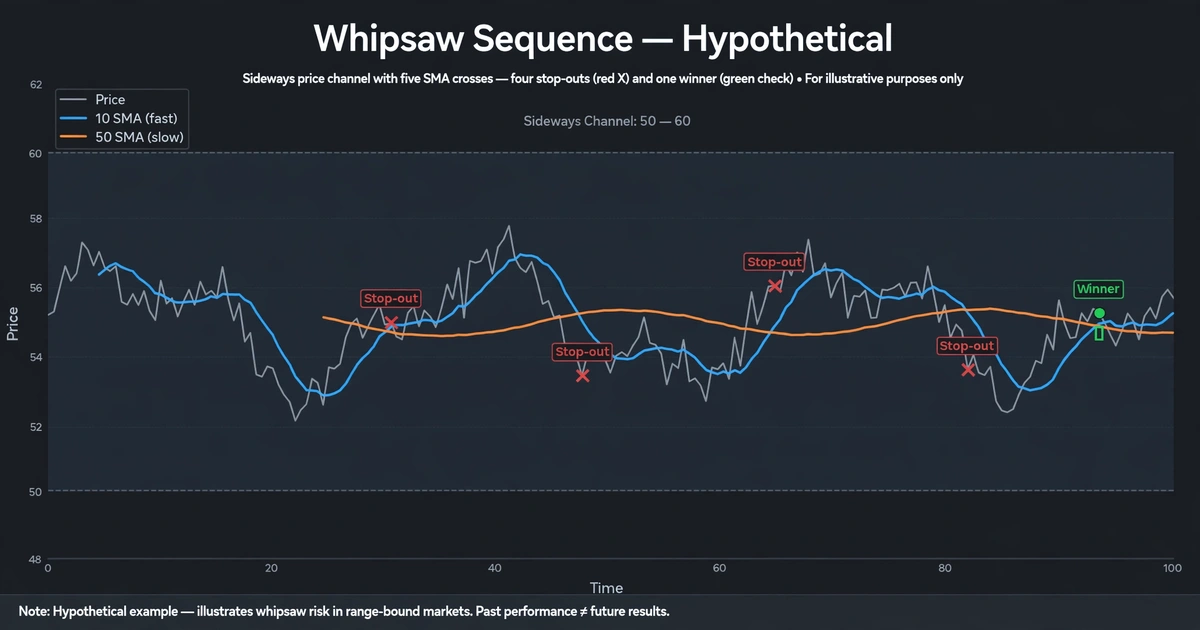
Four Whipsaws and One Trend: What Sideways Markets Cost
Now consider a hypothetical stretch where price drifts sideways. The 10 crosses the 50 five times in a few weeks. Four crosses reverse and hit the stop, and one catches a real move. At $50 risked each, the four losses total $200, or 4% of the $5,000 account.
To get back to even, the single winner has to make $200. With a 45-pip stop at $1.10 per pip, that needs about 182 pips, roughly four times the risk, before costs. That is possible in a strong trend and not guaranteed in any one case.
This is a hypothetical example for illustration only. The point is the arithmetic: a crossover system accepts a string of small losses and relies on occasional large winners to cover them. If you don’t have the temperament for a losing streak, the system will not suit you. Sideways conditions are better handled by methods built for them, such as those in range trading explained.
Slips That Quietly Drain a Crossover System
- Entering before the candle closes. A cross seen mid-candle often disappears by the close.
- Changing the settings after a losing week. Moving from 10/50 to 8/40 to 12/60 is curve fitting by hand. You end up tuned to the past.
- Ignoring costs in a test. Short timeframes produce many crosses, and each one pays the spread.
- Taking every cross in every market. A system that needs trends should not be run on a pair stuck in a range.
- Using the cross as the stop. Waiting for the opposite cross as the only protection can allow a large loss. Use a hard stop as well.
- Stacking trades after a cross. Adding positions on each new candle multiplies exposure beyond your risk plan.
Who Will Struggle With Crossover Systems
Skip this approach, or shrink your expectations, if any of these describe you:
- You can’t tolerate a run of four or five small losses without changing the rules.
- You want entries near the exact turning point. Crossovers confirm after the fact.
- You are trading a sideways market and expect the system to adapt.
- You only have a short window each day and trade a low-timeframe chart that needs constant checking.
- You are looking for a system with a high win rate. Trend systems often have a modest one and depend on the size of winners.
Lag, Whipsaws, and Gaps: How Crossover Trades Lose Money
Every part of this system has a way of failing, and it helps to name them before real money is involved.
Lag. The cross confirms a move that is already underway, so entries tend to come after part of the move is gone, and exits on the opposite cross hand back open profit.
Whipsaws. In ranges and choppy conditions, crosses reverse often. Each stop-out costs the stop distance plus spread, and the losses add up faster than most beginners expect.
Gaps and slippage. Price can jump past your stop around news or over a weekend, producing a loss larger than planned. A stop-loss limits loss only if the market fills it near your price.
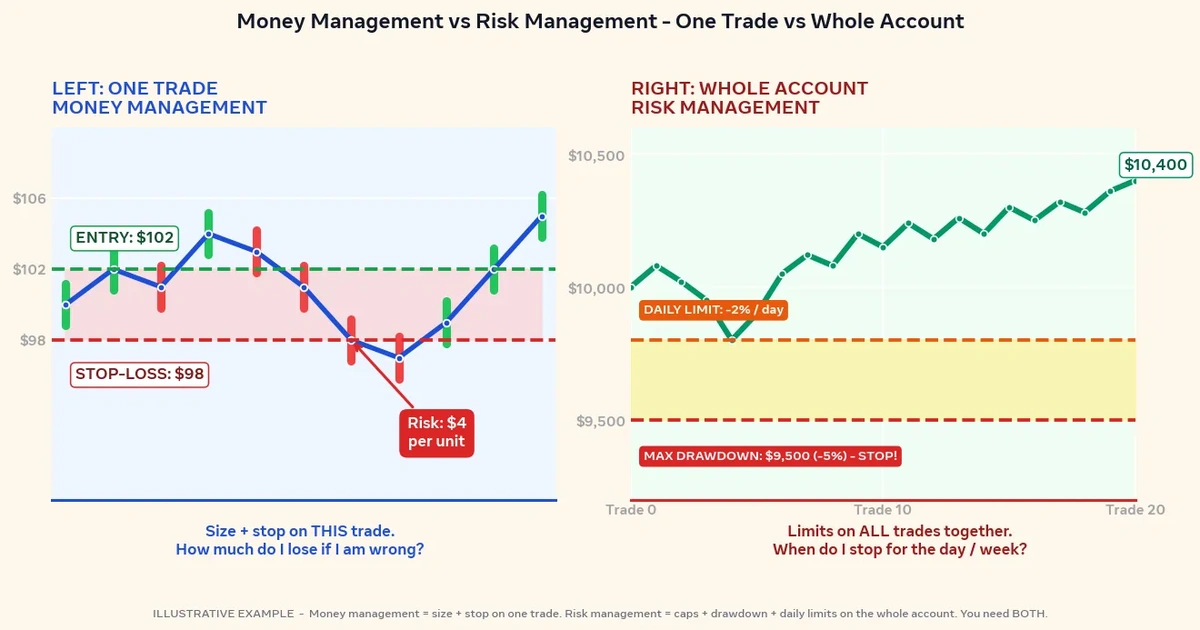
Leverage. Leverage magnifies losses as well as gains, and a trader can lose the full amount deposited. Sizing each trade as a small fixed percentage of the account, as laid out in the forex risk management complete guide, keeps one bad run survivable.
Backtest versus live. A backtest of moving average crossovers can look strong when spreads, slippage, and the stress of an open trade are left out. Parameter choices that fit a historical period may not hold in the next one.
Before You Load the 10 and 50: Answers to Common Doubts
Is the 10 and 50 moving average crossover profitable?
It can be in some market conditions and not in others. Trending markets tend to favor it, and ranges tend to hurt it. Results depend on costs, risk control, and how consistently you follow the rules. No setting of moving averages guarantees profit, so test on a demo account first.
Should I use SMA or EMA?
Either can be used. EMAs react faster and signal earlier but produce more false crosses, while SMAs are smoother and slower. Pick one, keep it fixed during testing, and compare results with costs included.
Which timeframe works best with the 10/50 cross?
No timeframe is best in all cases. Shorter charts give more signals but more noise and a heavier cost share. Slower charts give fewer, cleaner signals but need wider stops and more patience. Match the chart to your schedule and test it.
What is the difference between the 10/50 and the golden cross?
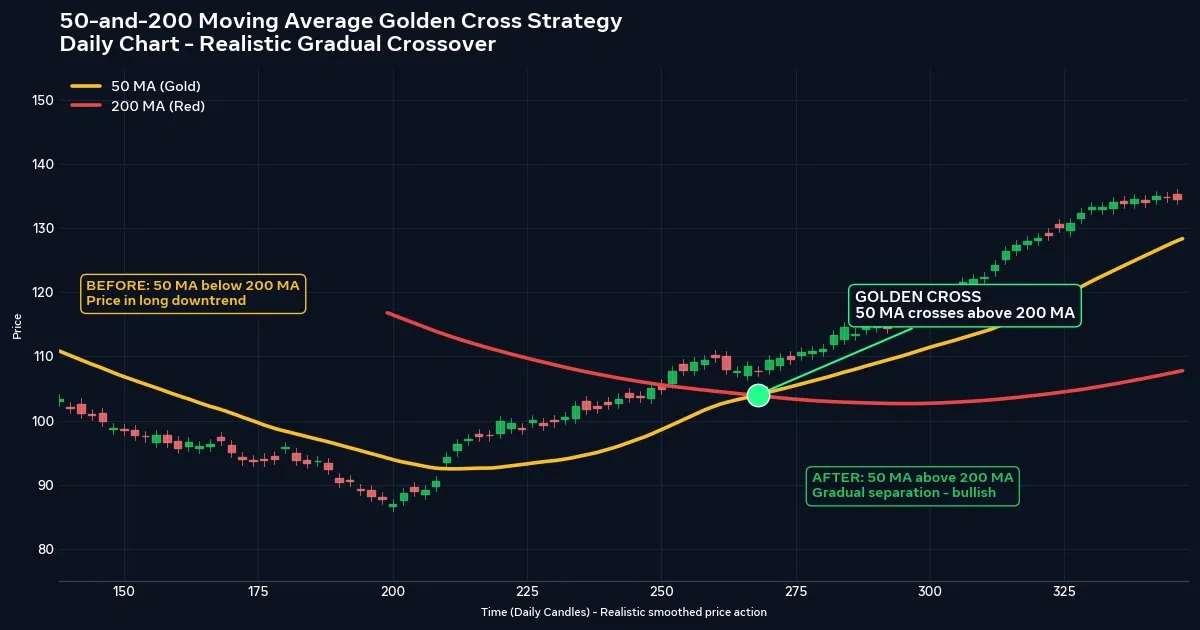
The golden cross is usually the 50-period average crossing above the 200-period, a much slower signal on longer charts. The 10/50 reacts faster and signals more often, with more false starts. See the 50 and 200 moving average golden cross strategy for the slower version.
Can I use this crossover with other indicators?
Yes. Many traders combine it with a trend-strength reading, a higher-timeframe direction check, or support and resistance levels. Add one filter at a time and check whether it improves results after costs, since each addition also removes trades.
A Cross Is a Late Witness, Not a Forecast
The 10 and 50 crossover gives you a clear, rule-based way to join a move after it has started. It does not tell you the move will continue, and it will often be wrong in a range. Its value lies in the discipline of a written rule and a fixed stop, not in the lines themselves.
For your next step, open a 4-hour chart of one pair and mark the last ten crosses by hand. Note how many were followed by a sustained move and how many reversed within a few candles. That tally will tell you more than any description.
Disclaimer
This article is for educational purposes only and is not financial advice. Forex and CFD trading involves a high level of risk, and you can lose some or all of your capital. Leverage can magnify both gains and losses. Never trade with money you can’t afford to lose.
This is a trading framework, not a guarantee. No strategy wins every trade, and results vary with market conditions, execution, and risk management.
Any percentages or figures shown are historical averages or hypothetical examples, not guarantees. Past performance does not predict future results.
Join now
Comments (0)
Be the first to comment.