
Trend Following Strategy for Beginners: A Complete Guide
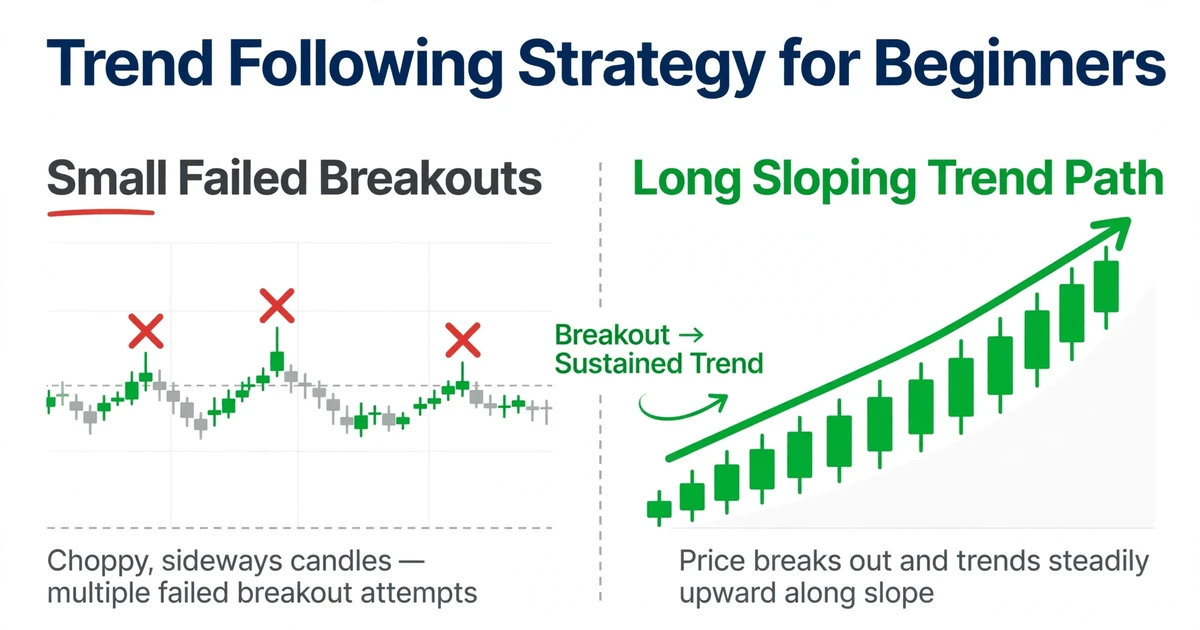
Most beginners expect a good strategy to win most of its trades. A trend following strategy usually does the opposite. It takes small, frequent losses and relies on a few large winners to carry the results, if they carry at all. That structure confuses newcomers, who often quit after the fourth stopped-out trade, just before the move the system was built to catch. This guide assembles a complete beginner-friendly rule set, from trend filter to entry, stop, exit, and position size. It then runs the math on a hypothetical trade and a run of ten, and covers the risks plainly.
A Trend Following System Fits in Five Rules
- Filter: Trade only in the direction of a trend you’ve defined with an objective rule.
- Entry: Use a fixed, written trigger, such as a breakout or an average crossover.
- Stop: Place it before entry, sized by volatility, and size the position from it.
- Exit: Use a trailing rule rather than a fixed target, so winners can run.
- Risk: Risk a small, fixed amount per trade, because losing streaks are normal.
It’s a framework to test, not a guarantee.
Following Versus Predicting: What Makes a Strategy Trend Following
Trend following isn’t a forecast that a currency will keep rising. It’s a rule: when price has moved far enough in one direction to meet your definition of a trend, join it, and leave when your exit rule says the move has weakened. The system never tries to buy the exact low or sell the exact high. It accepts entering late and exiting late as the price of not guessing.
That separates it from the discretionary approach in our look at trend trading explained, where a trader reads pullbacks and swing structure by eye. Trend following removes most of the eyeballing. If two people apply the same rules to the same chart, they should get the same signals.
The reasons trends can persist are commonly cited: policy cycles that play out over months, large players building positions gradually, and momentum that attracts more participants. None of them is guaranteed, and trends can stall for long stretches.
Low Win Rate, Large Winners: The Expectancy Arithmetic
Expectancy is the average result per trade, measured in R, where 1R is the amount you risk. The formula is:
Expectancy = (win rate × average win) − (loss rate × average loss)
Here are three hypothetical profiles, each with losses fixed at 1R:
| Win rate | Average winner | Calculation | Expectancy per trade |
|---|---|---|---|
| 30% | 3R | (0.30 × 3) − (0.70 × 1) = 0.90 − 0.70 | +0.20R |
| 40% | 1.5R | (0.40 × 1.5) − (0.60 × 1) = 0.60 − 0.60 | 0.00R |
| 60% | 0.5R | (0.60 × 0.5) − (0.40 × 1) = 0.30 − 0.40 | −0.10R |
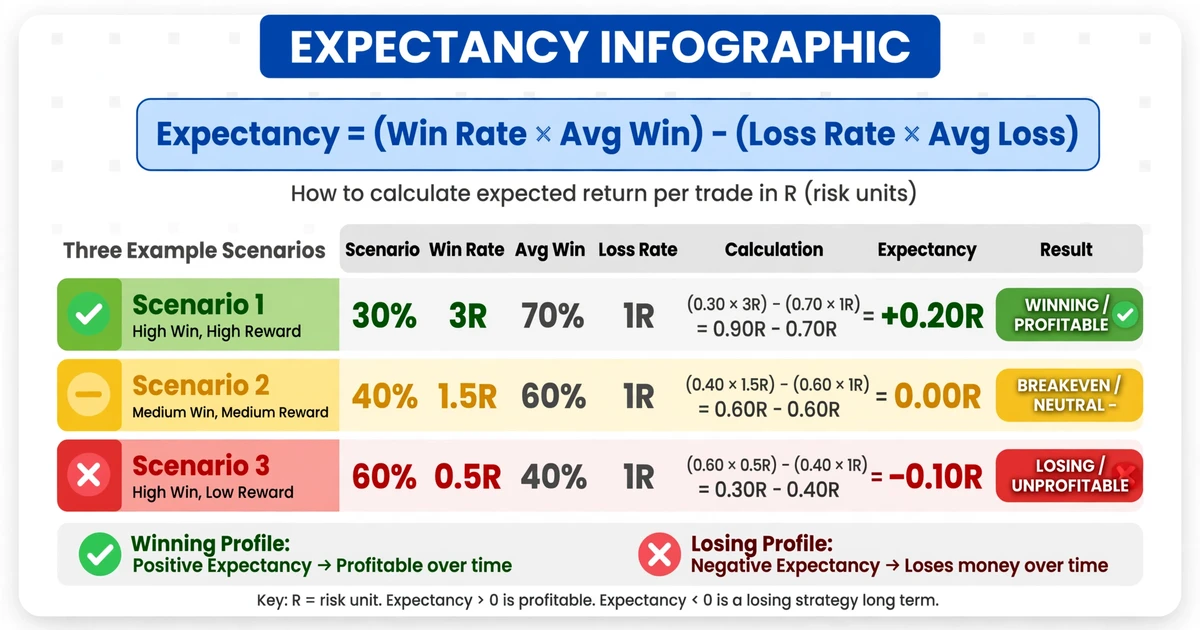
The 60% win rate loses money because its winners are tiny. The 30% win rate comes out ahead because its winners are large. That’s the structure trend followers aim for: win less often, win bigger, and keep losses small. These are illustrations of the arithmetic, not results any system is known to produce. Spreads, commissions, and slippage reduce every number in the table.
Picking the Filter That Says Which Side to Trade
The filter answers one question: long only, short only, or no trade? Three common options:
| Filter | Example rule | Strength | Weakness |
|---|---|---|---|
| Long moving average | Long only while price is above the 200-day average | Simple and slow to flip | Late at turning points, and a flat average invites whipsaws |
| Channel position | Long only after a close above the prior 20-day high | Objective and quick to react | Fails often in sideways markets |
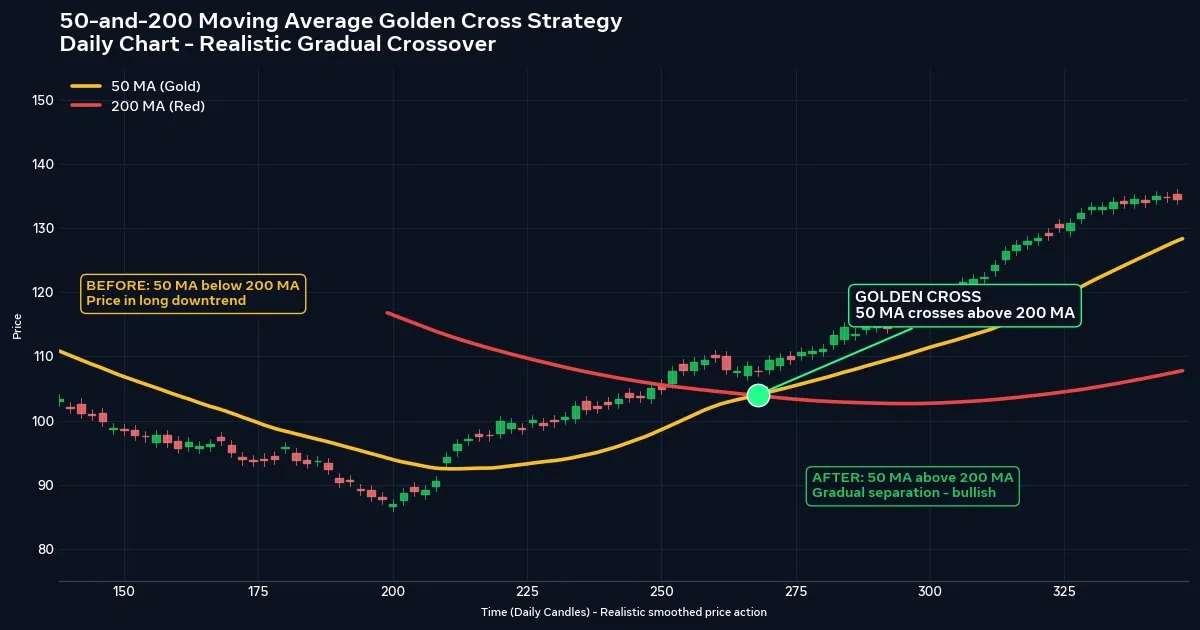
| Average crossover | Long while the 50-day is above the 200-day | Fully mechanical | Very late, with few signals |
The slow end of that spectrum is the 50 and 200 moving average golden cross strategy, which trades fewer signals for less noise. Pick one filter, write it in a sentence, and resist swapping it every time it loses.
Entry Triggers You Can Write in One Sentence
A good trigger is specific enough that you can’t argue with it. Three examples:
- Channel breakout: Buy when a daily candle closes above the highest high of the previous 20 days.
- Average cross: Buy when the 20-day average closes above the 50-day average.
- Filter plus breakout: Buy a 20-day breakout only while price is above the 200-day average, and sell short in the mirror-image case.
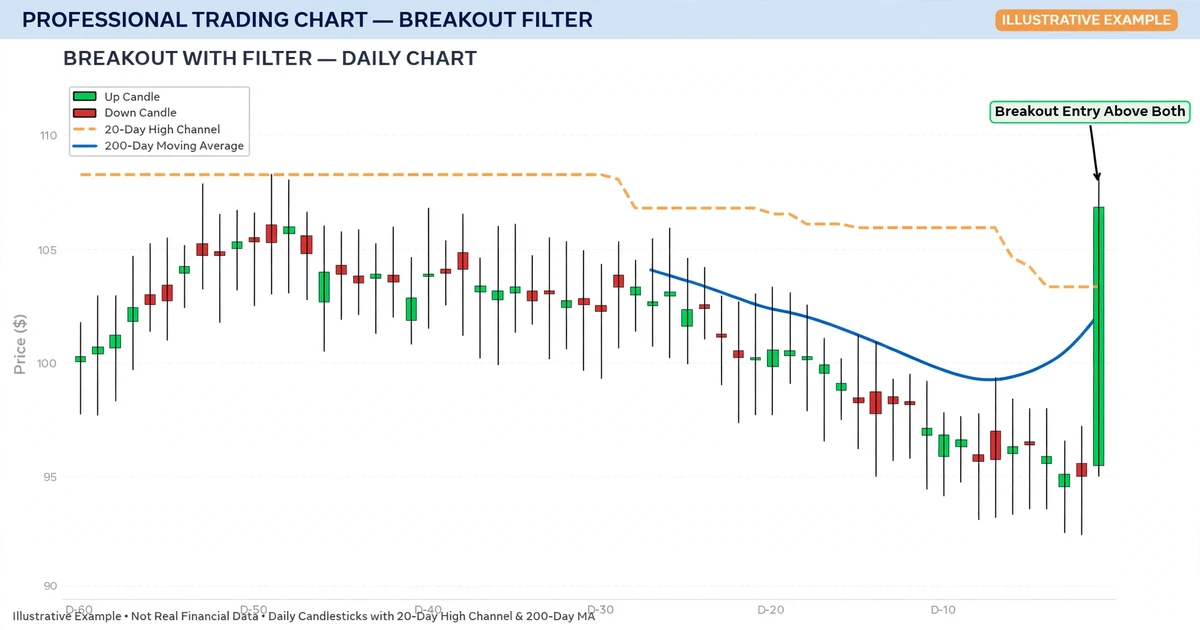
Breakout entries tend to fill during fast moves, so slippage can leave your real entry worse than the level on the chart. Many beginners start with a close-based trigger evaluated once a day, which keeps decisions calm and the signal count low. There’s no entry that avoids false starts, only entries that accept them in different ways.
Stops Sized by Volatility, Not by Hope
A trend system needs a stop wide enough to survive normal noise and tight enough to cap the loss. A common approach uses Average True Range (ATR), the typical daily candle range over a set window, usually 14 periods. The stop goes at a multiple of ATR from entry, often 2×, though the multiple is a choice to test, not a rule.
Position size then falls out of the stop:
Lots = dollars at risk ÷ (stop distance in pips × pip value per lot)
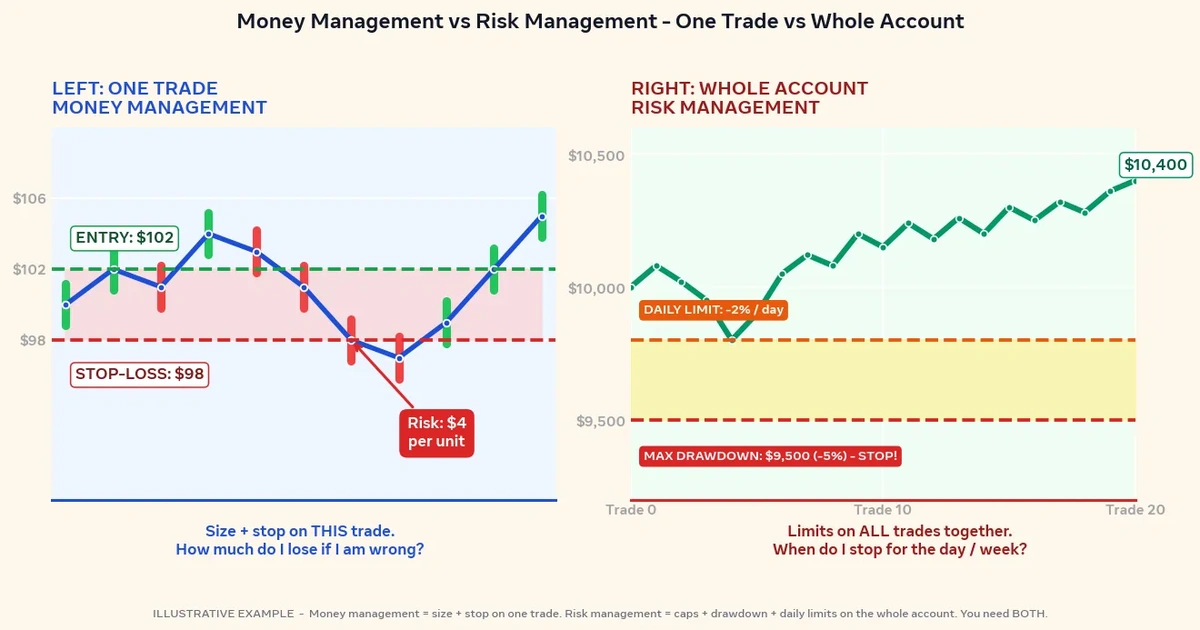
Because the stop is wide on a daily chart, the position is small. That’s intentional. A fixed percentage of risk per trade is what keeps a string of losses survivable, and our forex risk management guide goes deeper on choosing and applying those limits. Pip value also depends on the pair and your account currency, so recalculate it for each trade rather than reusing a number.
One caution for small accounts: if the minimum trade size forces you to risk more than your plan allows, the system isn’t suited to that account yet.
Trailing Exits and the Discomfort of Giving Back Open Profit
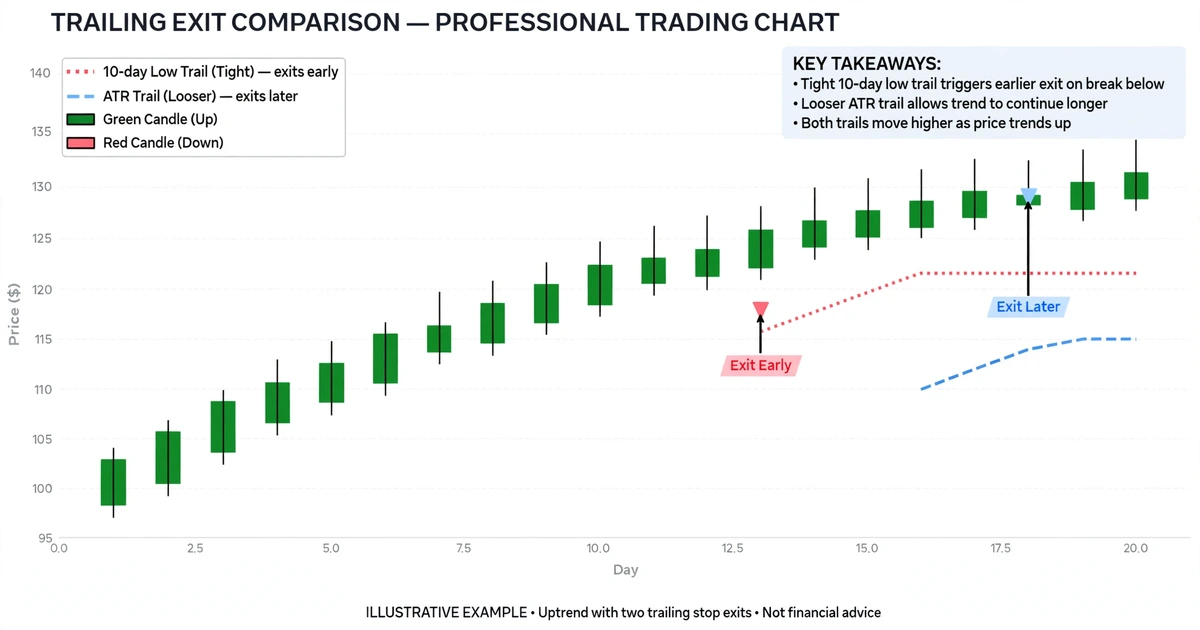
Trend followers usually skip fixed profit targets, because a target caps the very winners the system depends on. Instead, a trailing exit follows price and closes the trade when the trend weakens. Three common versions:
- Lowest low of N days. Exit when price closes below the lowest low of the past 10 days (for longs).
- ATR trail. Keep the stop a set multiple of ATR below the highest close since entry.
- Average exit. Exit on a close below a moving average, such as the 20-day.
All of them share a trade-off. A tight trail protects open profit but gets shaken out by ordinary pullbacks. A loose trail lets the trend breathe but returns more of the profit before exiting. Giving back part of a gain is the cost of the method, not a malfunction. If that sounds intolerable, the system may not suit your temperament.
Signal to Exit: A 20-Day Breakout in USD/JPY
Imagine a trader with a $6,000 USD account who risks 1% ($60) per trade, using these rules on the daily chart: go long on a close above the prior 20-day high while price is above the 200-day average. The stop sits 2 × ATR(14) below entry, and the exit is a close below the 10-day low.
On the signal day, USD/JPY closes at 148.50. The prior 20-day high is 148.30 and the 200-day average is 143.00. ATR(14) is 1.10 yen, or 110 pips, since a pip on this pair is 0.01.
This is a hypothetical example for illustration only.
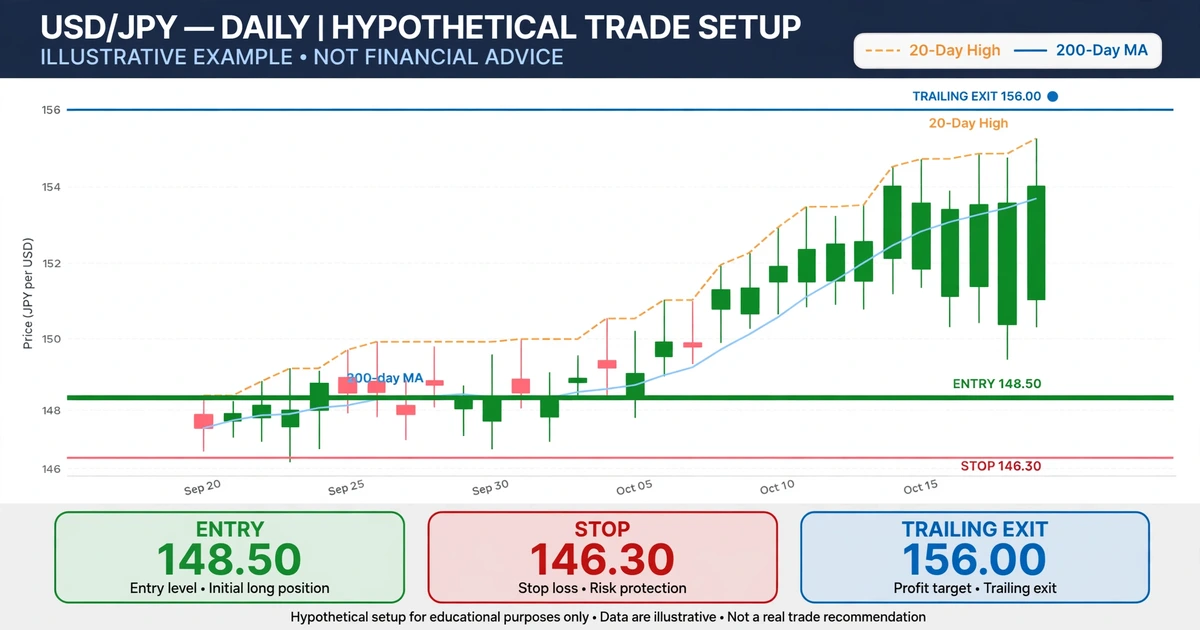
Stop distance: 2 × 110 = 220 pips, so the stop is 148.50 − 2.20 = 146.30.
Pip value: In a USD account, one pip on a yen pair is 1,000 yen per standard lot converted to dollars. At 148.50 that’s 1,000 ÷ 148.50 = about $6.73.
Position size: $60 ÷ (220 × $6.73) = 0.0405 lots, rounded down to 0.04 lots. Planned risk is about $59.
Two ways it could end:
- Stopped out. Price falls to 146.30. The loss is 220 pips on 4,000 units, which is 8,800 yen, or about $60 at the exit rate. It differs slightly from $59 because the yen is converted at a different rate.
- Trailing exit. Price trends up and the 10-day-low rule closes the trade at 156.00. The gain is 7.50 yen × 4,000 units = 30,000 yen, or about $192, roughly 3.2 times the planned risk.
A one-pip spread would cost under $1 at this size, but slippage on a breakout fill could cost more. The trade could also stall near entry for weeks, then end with a small gain or loss.
Ten Trades in R-Multiples: How 30% Winners Can Still Add Up
One trade tells you little. Here’s a hypothetical sequence for the same rules, again in R:
| Trade | Result (R) | Running total (R) |
|---|---|---|
| 1 | −1.0 | −1.0 |
| 2 | −1.0 | −2.0 |
| 3 | −1.0 | −3.0 |
| 4 | −1.0 | −4.0 |
| 5 | +1.5 | −2.5 |
| 6 | −1.0 | −3.5 |
| 7 | 0.0 | −3.5 |
| 8 | +2.0 | −1.5 |
| 9 | −1.0 | −2.5 |
| 10 | +6.0 | +3.5 |
Six losses, one breakeven, and three winners add up to +3.5R, or 0.35R per trade, before costs. If spread and slippage averaged 0.1R per trade, that falls to 2.5R in total, or 0.25R per trade.
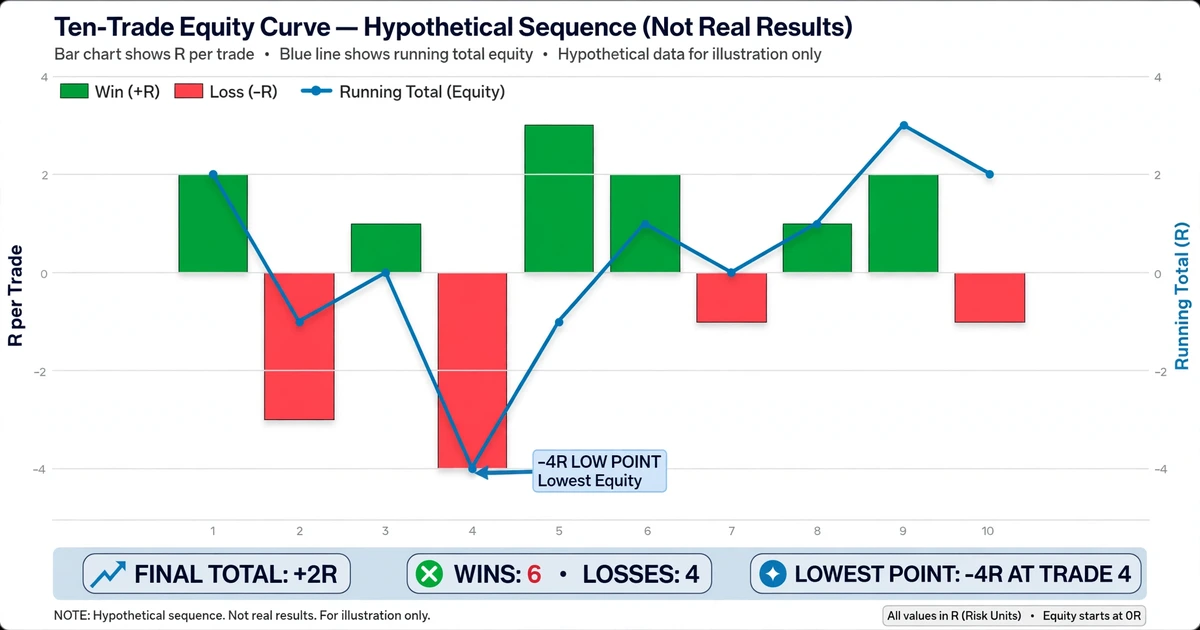
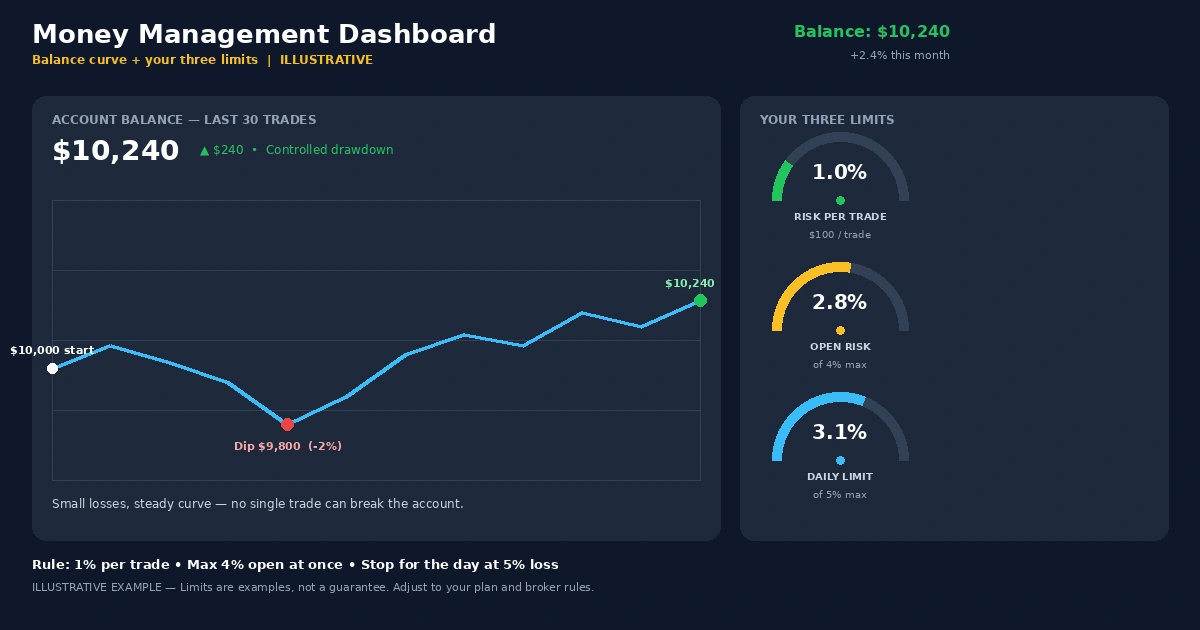
The more instructive number is the drawdown. The first four trades lose 4R, which is about 4% of the account at 1% risk, or roughly $240 here, before any winner arrives. Most of the profit in this run came from one trade. This is a made-up sequence, and a real one could look much worse or never recover.
A Daily Chart, a Short Pair List, and a Cap on Total Risk
Most beginners do well starting on the daily chart. There are fewer signals, less noise, and spreads are small compared with stops. Pick a few pairs rather than twenty, so you can actually follow them.
Correlation is the hidden trap. Being long EUR/USD, long GBP/USD, and short USD/JPY can be one large bet against the dollar dressed up as three trades. If the dollar reverses, all three stops can be hit together, and 1% risk per trade quietly becomes 3% in one idea. Decide in advance on a ceiling for combined open risk, and count correlated trades as one position.
Testing Before Trusting: A Plan for Your First 50 Signals
- Write the rules for filter, entry, stop, exit, and size on one page, with no room for interpretation.
- Scroll through history candle by candle, covering the future so you can’t peek, and mark every signal the rules would have given, including ugly ones.
- Log each result in R, with costs included.
- Forward-test on a demo account on one pair, with the same rules and the same size.
- Compare the two logs. If live signals differ from the chart-marked ones, find out why.
Use round, ordinary settings (20 days, 50 days, 200 days) rather than hunting for the numbers that made the past look best. Settings tuned to history tend to weaken on new data. And since trends cluster in time, fifty signals can come from one friendly or hostile stretch, so treat any result as a clue, not proof.
Abandoning the System at the Fourth Loss and Other Beginner Errors
- Quitting during a normal losing streak, which is built into a low win rate and often arrives just before a winner.
- Skipping signals after a loss. Trend systems depend on catching the few big moves, and you can’t know in advance which signal that will be.
- Adding filters after each loss until the rules have so many conditions they never trigger.
- Moving the stop closer to avoid a loss you’ve already accepted on paper.
- Using a tight stop on a daily-chart system. It sits inside normal volatility and gets hit on noise.
- Stacking correlated positions so that one dollar move counts as several losses at once.
- Cutting winners at the first pullback, which removes the profits that pay for all the small losses.
Long Drawdowns, Choppy Markets, and Gap Risk: The Price of Following Trends
- Drawdowns can be long. Trend systems may go many trades, or many months, without a new equity high. Losses compound emotionally as well as financially.
- Range-bound markets. Sideways stretches produce repeated breakouts that fail, each costing a small loss.
- Gaps and slippage. A news release or weekend gap can jump past your stop, so the loss may exceed 1R. Breakout orders can also fill worse than the chart level in fast markets.
- Leverage. Leverage magnifies gains and losses alike, and a losing streak on a leveraged account can use up capital faster than most beginners expect.
- Regime change. Trends in currencies have been strong in some periods and scarce in others, and a system that looked robust in one can lag for years in another.
- Backtest versus live. Hand-marked history overstates how clean signals looked in real time, and fitted settings often fade.
- Behavioral risk. Following the rules through eight losses is hard, and the most common way these systems fail is that the trader stops following them.
A Temperament Check: Can You Follow Rules Through Eight Losses in a Row?
Trend following tends to suit people who are comfortable with a modest win rate, can wait through quiet stretches, and are willing to keep rules fixed when results are poor. Checking charts once a day fits well, because the signals are slow.
It’s a harder fit if you need frequent wins to stay motivated, if you’d feel compelled to override rules after a loss, or if your account is so small that the smallest lot size breaks your risk limit. None of that is a flaw. It’s useful information, and it’s the kind of question worth working through when you choose your trading style.
Hard Questions for a Beginner’s First Trend System
What’s the difference between trend following and trend trading?
Trend trading is the broad idea of trading in the direction of the prevailing move, often with discretion about pullbacks and structure. Trend following is the rule-based version: objective filters, fixed entries, volatility-based stops, and trailing exits that leave little room for judgment. Following can be considered a stricter subset of trend trading.
What win rate should a trend following system have?
There’s no required number. Many trend following systems are described as having win rates below 50%, because they accept frequent small losses in exchange for occasional large gains. What matters is expectancy, which combines win rate with average winner and loser size, after costs. A high win rate with tiny winners can still lose money.
Which timeframe suits a first trend following system?
The daily chart is a common starting point because it produces fewer signals, filters more noise, and keeps spread costs small relative to stop distance. Lower timeframes give more signals but also more false ones and higher relative costs. Choose a timeframe you can check consistently without feeling pressure to act.
Does trend following work in forex?
Currencies have trended strongly in some periods, but results vary by pair, period, and rule set, and trend strategies have gone through long flat or losing stretches. There’s no guarantee that past behavior continues. Testing your own rules with realistic costs on a demo account is more informative than general claims.
How many trades do I need before I know if it works?
A few dozen is a minimum for a rough picture, and even that can mislead, because trades cluster in time. If all fifty signals came from one market phase, you’ve learned about that phase. Track results in R, include costs, and treat the conclusions as provisional until conditions have changed at least once.
Rules You Can Check Beat Instincts You Can’t
Trend following replaces forecasting with a few written rules and accepts frequent small losses as the cost of occasionally catching a long move. Its edge, if there is one, lives in the discipline to keep the rules unchanged. For your next step, put your five rules on a single page, then scroll back through 50 daily candles on one pair and mark every signal they would have produced, the awkward ones included.
Disclaimer
This article is for educational purposes only and is not financial advice. Forex and CFD trading involves a high level of risk, and you can lose some or all of your capital. Leverage can magnify both gains and losses. Never trade with money you can’t afford to lose.
This is a trading framework, not a guarantee. No strategy wins every trade, and results vary with market conditions, execution, and risk management.
Any percentages or figures shown are historical averages or hypothetical examples, not guarantees. Past performance does not predict future results.
Join now

Comments (0)
Be the first to comment.