
8, 21, and 55 EMA Trading Strategy: Rules, Entries, and Risk
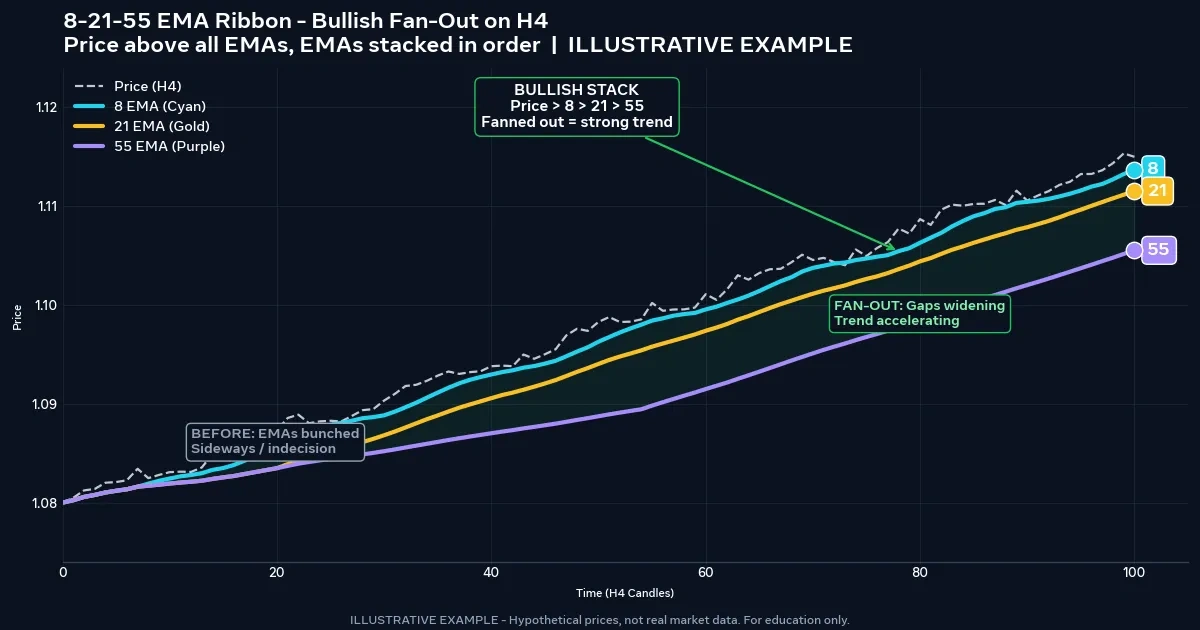
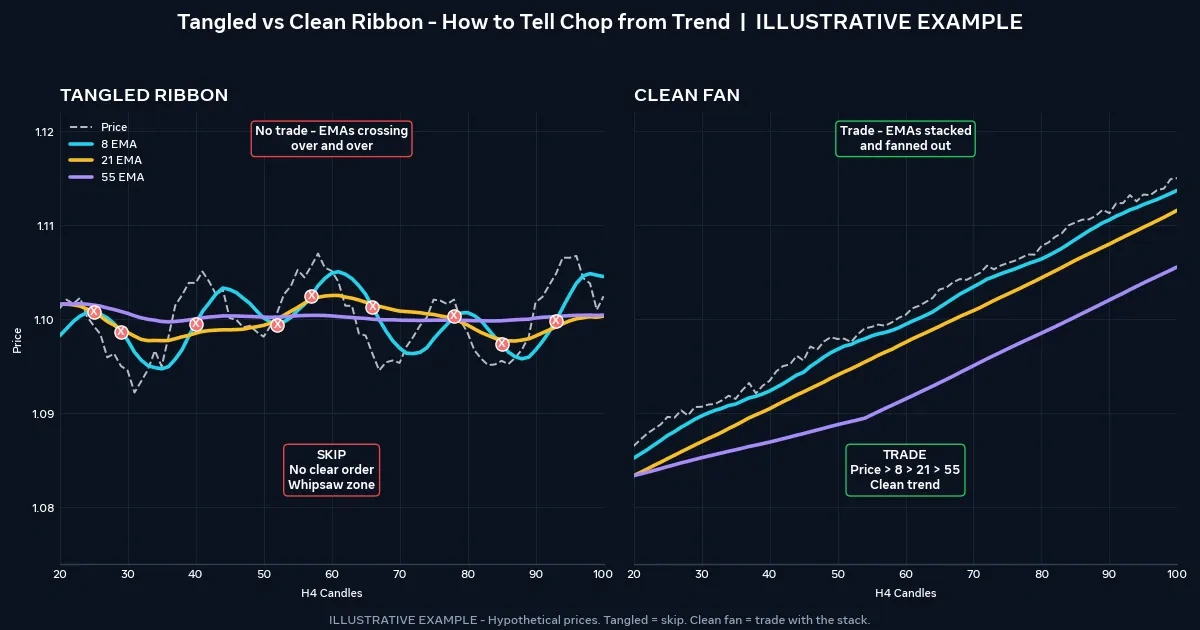
Add three exponential moving averages to an H4 chart and one of two pictures appears. Either the lines fan out in tidy order, like cards in an open hand, or they knot together like tangled earbuds. The 8, 21, and 55 EMA trading strategy is built around telling those two pictures apart, then trading only the first one. It won’t predict where price goes next, and no setup wins every trade. What it can give you is a rule-based way to join a trend that’s already moving, with a stop and a target set before you enter.
Fan Open, Fan Ordered: The Strategy in Five Lines
- Trend filter: Trade long only when the 8 EMA is above the 21, the 21 is above the 55, and all three slope upward. Reverse for shorts.
- Entry zone: Wait for price to pull back into the space between the 8 and 21 EMAs, not chase it away from them.
- Trigger: Enter after a candle closes back in the trend direction, past the fast 8 EMA.
- Stop: Place it beyond the pullback swing and beyond the 55 EMA.
- Target: Aim for the prior swing high or a fixed multiple of your risk, and skip trades where the reward is too small.
Why 8, 21, and 55 Work as a Ribbon, Not as Three Separate Signals
An exponential moving average (EMA) is a moving average that gives more weight to recent prices than old ones. Each new value is calculated as: EMA = Price × k + Previous EMA × (1 − k), where k = 2 ÷ (N + 1). For these three periods:
- 8 EMA: k = 2 ÷ 9 = 0.2222
- 21 EMA: k = 2 ÷ 22 = 0.0909
- 55 EMA: k = 2 ÷ 56 = 0.0357
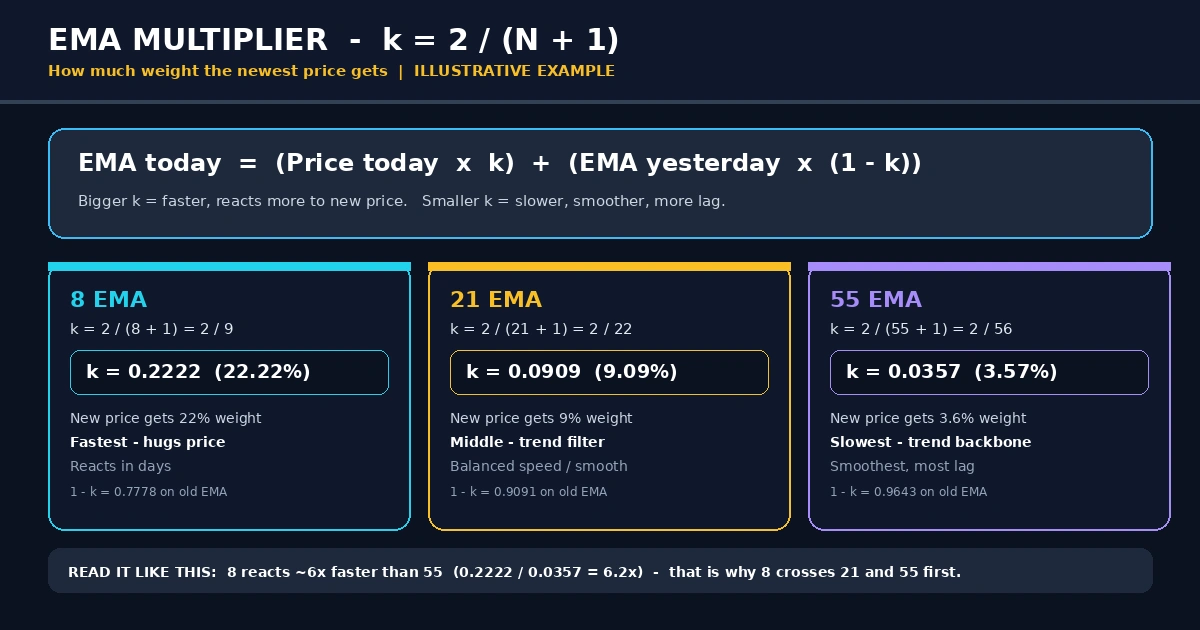
A higher k means the line reacts faster. That’s why the 8 hugs price while the 55 moves like a slow tide.
Each line has a job. The 8 EMA shows short-term momentum and helps time entries. The 21 EMA marks the working rhythm of the trend, and pullbacks often pause near it. The 55 EMA acts as the anchor, the line whose slope and position tell you whether the bigger move is still intact.
All three are Fibonacci numbers, and each period is roughly 2.6 times the one before it (21 ÷ 8 ≈ 2.63, 55 ÷ 21 ≈ 2.62). That spacing is useful because the lines separate cleanly on a chart. There’s no evidence the Fibonacci link gives them any special market power, so treat it as a convenient set, not magic. The rules below reflect how this ribbon is commonly taught. They aren’t a backtested system, and you should test them yourself.
Reading the Ribbon: Stack, Slope, and Spacing
The ribbon gives you three pieces of information at once: order, direction, and distance between the lines. It’s one visual way to apply the ideas in trend trading explained, where you look for a clear directional move before looking for an entry.
A Bullish Stack
The 8 sits above the 21, the 21 above the 55, price trades mostly above all three, and every line slopes up. Gaps between the lines should be fairly even or gently widening. A wide, healthy fan suggests momentum is established.
A Bearish Stack
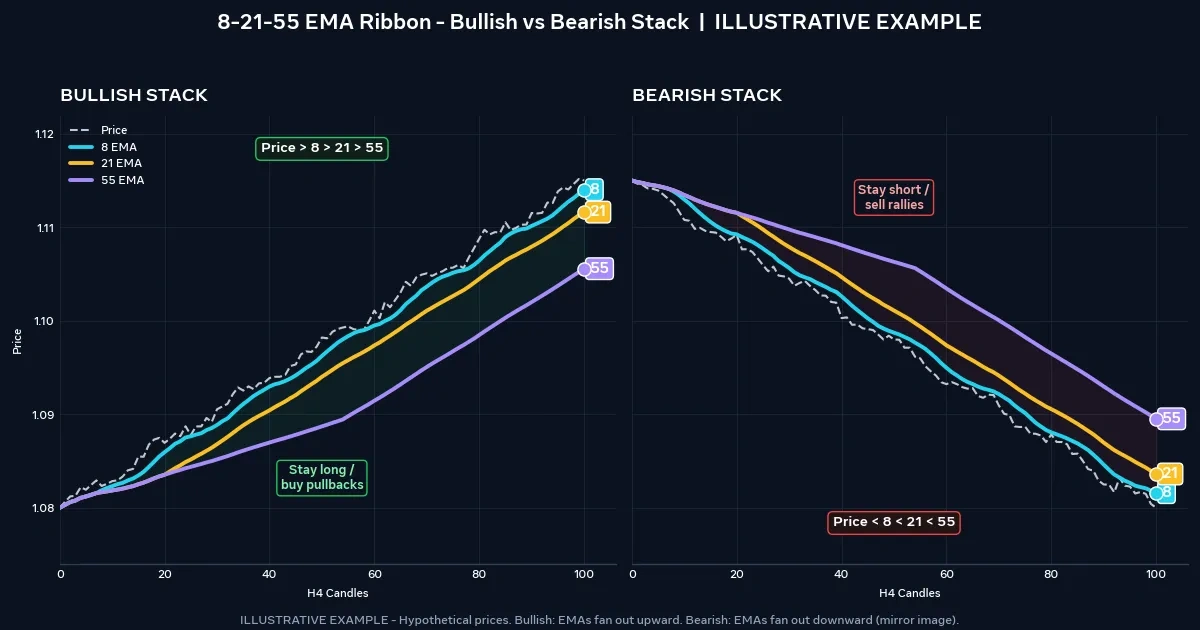
The mirror image: 8 below 21, 21 below 55, price mostly under the ribbon, all slopes pointing down. The same logic applies in reverse.
A Tangled Ribbon
The lines cross one another, run flat, or bunch within a few pips. This isn’t a signal. It’s a message that no clear trend exists right now, and the strategy sits out.
Entry Rules for a Pullback to the 21 EMA
Pullback entries are the core of this approach. You wait for the trend to take a breath, then join it as it resumes. Here’s a long-side checklist, with shorts as the mirror image.
- Stack is intact. 8 > 21 > 55, and the 55 has sloped up for a meaningful stretch (roughly ten or more candles on your timeframe is a common guideline).
- Price pulls back into the zone between the 8 and 21 EMAs, or dips briefly to the 21.
- Trigger candle. A bullish candle closes back above the 8 EMA. Place a buy-stop just above its high.
- Stop-loss. Put it below the pullback swing low and below the 55 EMA, with a small buffer for spread and noise.
- Target. Use the prior swing high, or a fixed multiple of your risk such as 2R (twice the distance to your stop).
- Skip rule. If the stop distance is so wide that the target gives less than about 1.5R, pass on the trade.
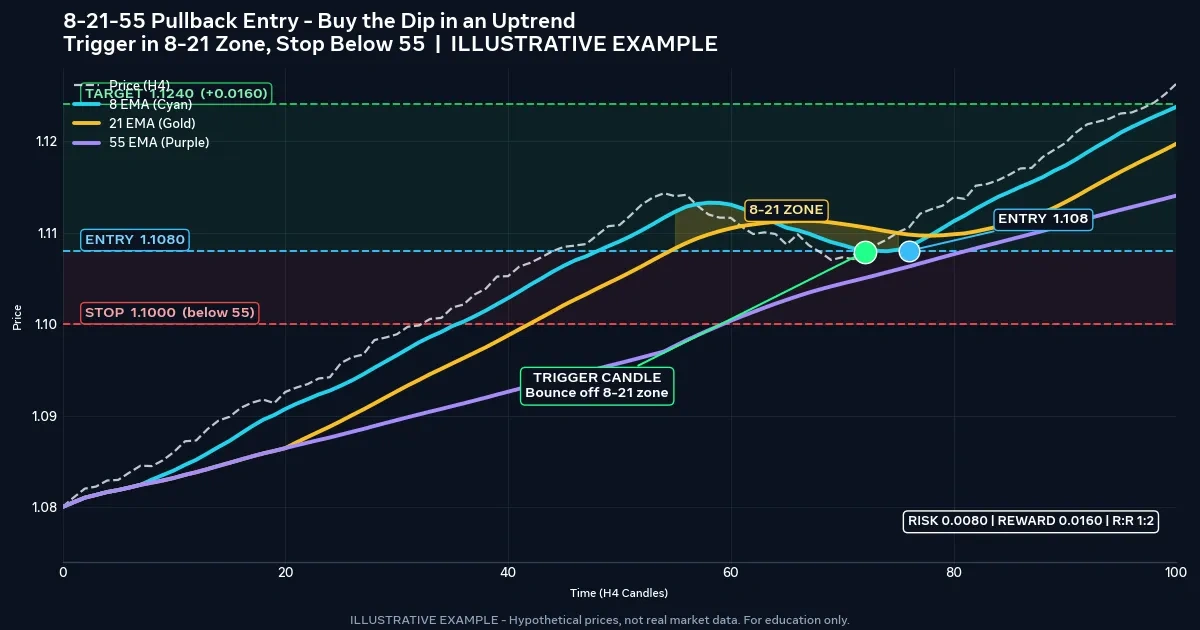
If price closes decisively beyond the 55 EMA against your trade, the pullback has likely become a reversal. That’s what the stop is for. Many traders also trail the stop behind the 21 EMA once the trade is moving, though that choice trades profit-locking for earlier exits.
The 8-Crosses-21 Trigger and Its Lag
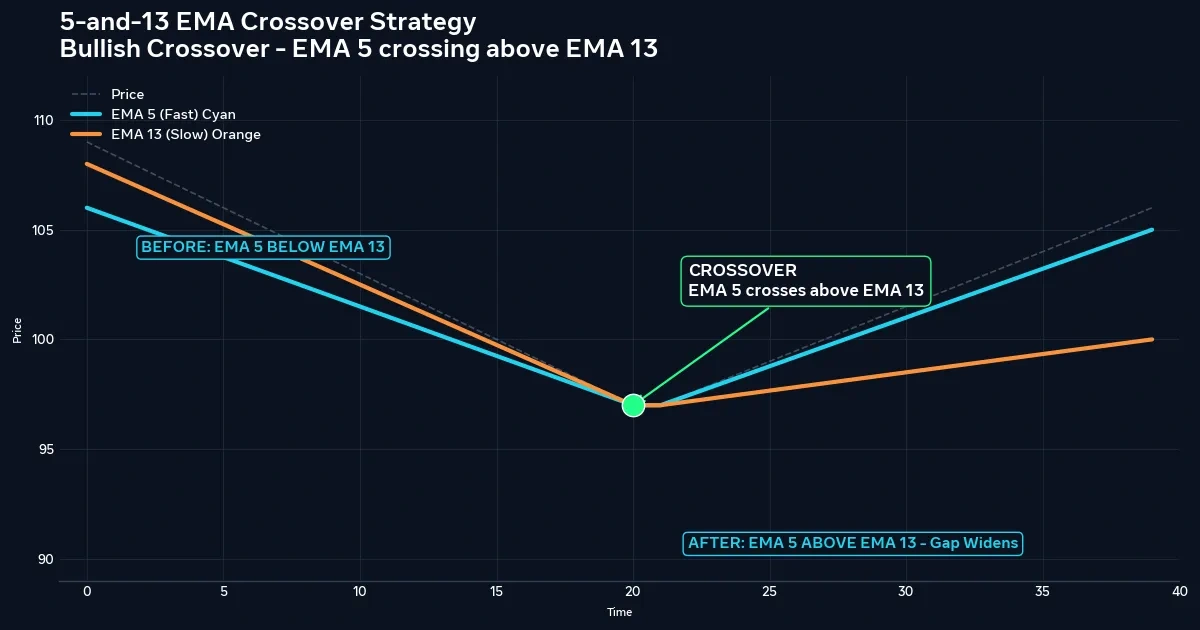
Some traders enter when the 8 EMA crosses back over the 21 after a pullback. This works as a confirmation, but crossovers are lagging signals, since both lines have to bend before they cross. By the time it triggers, a good portion of the resumption may already be behind you, and your stop sits further away.
If you use it, require the 55 to still slope in the trade direction. A cross against a flat or reversing 55 is the single most common source of false signals.
Which Timeframe Gives the Ribbon Room to Work
| Timeframe | How the ribbon tends to behave | Trade-off |
|---|---|---|
| M15 | Frequent pullbacks, frequent tangles | Spread and commission take a larger bite of each trade |
| H1 | Cleaner stacks, moderate signal count | Needs more screen time during active sessions |
| H4 | Slower, smoother fans | Fewer setups, wider stops |
| Daily | Very smooth trend structure | Few trades, large stop distances, overnight swap costs |
Many beginners find H1 and H4 easier to read, because spread is a smaller share of the stop distance. On lower timeframes, activity clusters around the London and New York overlap. That’s roughly 13:00 to 17:00 UTC when both regions are on standard time, and 12:00 to 16:00 UTC when both are on daylight time. The window shifts for a few weeks each year because the clock changes happen on different dates.
Buying an AUD/USD Pullback to the 21 EMA: A Hypothetical H4 Trade
Picture a trader with a $5,000 account who risks 1% per trade, or $50. On an H4 chart of AUD/USD, the ribbon is stacked bullishly. Price has dipped from a swing high at 0.6730 and found support around 0.6628, between the 21 EMA (0.6636) and the 55 EMA (0.6622). A bullish candle then closes above the 8 EMA (0.6644), and the trader places a buy-stop at 0.6650, just above that candle’s high.
This is a hypothetical example for illustration only. The prices are invented, not a live setup.
| Item | Value |
|---|---|
| Entry (buy-stop) | 0.6650 |
| Stop-loss | 0.6610 (18 pips below the swing low, 12 below the 55 EMA) |
| Stop distance | 40 pips |
| Target | 0.6730 (prior swing high), 80 pips = 2R |
| Pip value, 1 micro lot (1,000 units), USD account | $0.10 |
| Risk per micro lot | 40 × $0.10 = $4.00 |
| Position size | $50 ÷ $4.00 = 12.5, rounded down to 12 micro lots |
| Actual risk | 12 × $4.00 = $48 |
| Reward if target hits | 12 × $0.10 × 80 = $96 |
Costs matter. Suppose spread, commission, and slippage total about 1.5 pips. The loss grows to roughly 41.5 × $1.20 = $49.80, and the win shrinks to about 78.5 × $1.20 = $94.20.
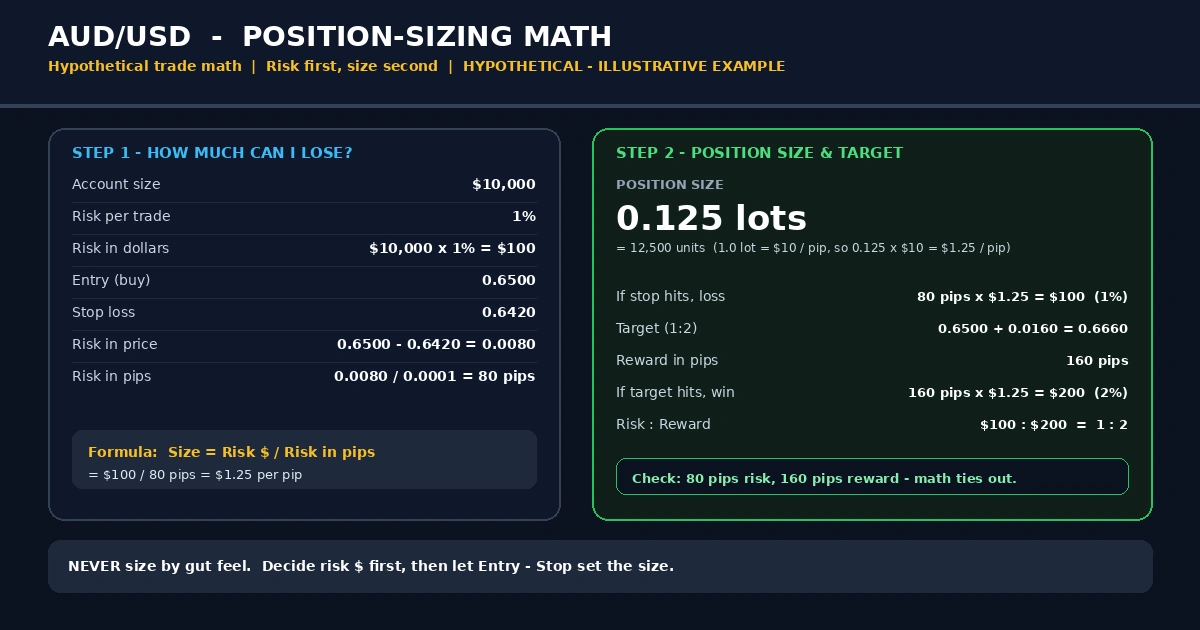
At a 2:1 reward-to-risk ratio, a strategy needs to win about one trade in three (1 ÷ 3 = 33.3%) to break even before costs. That’s arithmetic about the payoff structure, not a forecast of how often this setup wins. Stops can also fill worse than planned in fast markets or around news.
When the Ribbon Tangles: Chop, Compression, and Stretched Moves
The strategy fails in predictable places. Watch for these:
- Tangled lines. If the 8, 21, and 55 cross each other repeatedly, the market is ranging. Sideways conditions call for a different approach, like range trading explained in its own guide, and not pullback rules built for trends.
- Flat 55. A stack with a flat 55 EMA is a weak trend at best.
- Stretched price. If price has run far from the 21 EMA with no pullback, entering late means a wide stop and a poor reward.
- Compression before news. Lines squeezing together ahead of a major release can break either way, and the stack will lag behind.
Where the Ribbon Overlaps With Two-EMA Systems
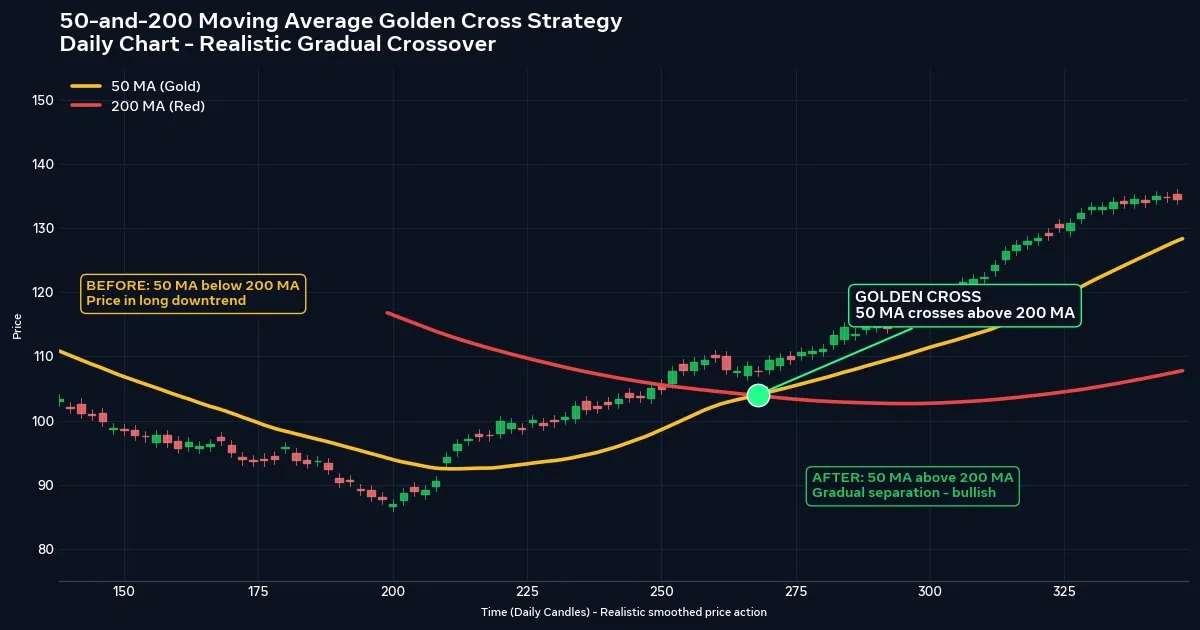
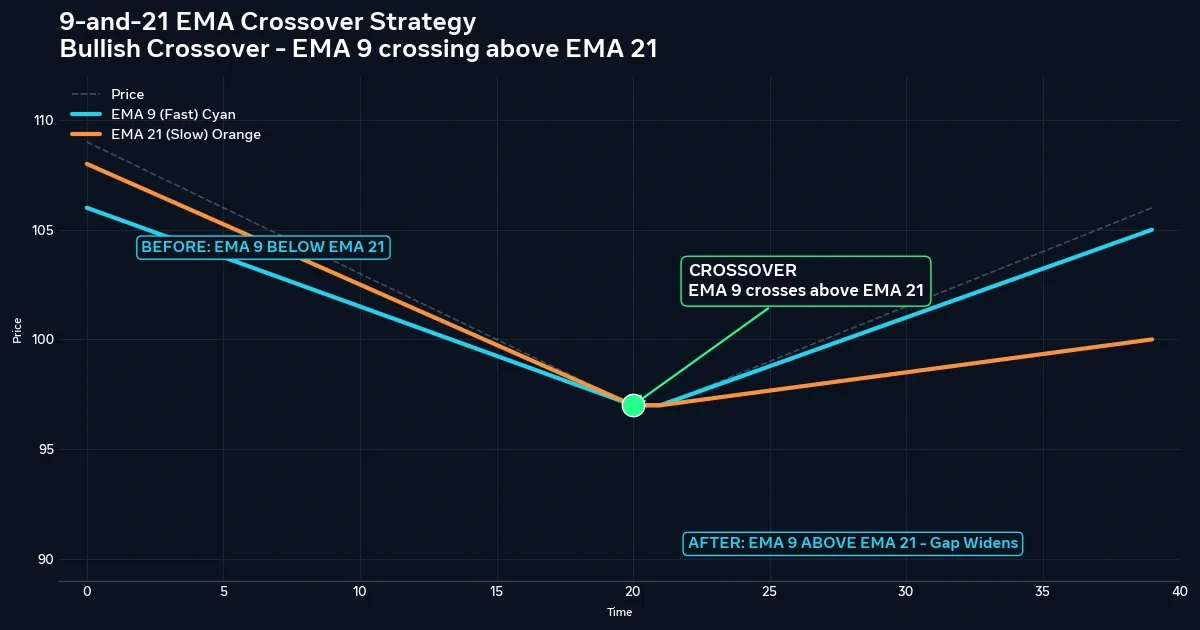
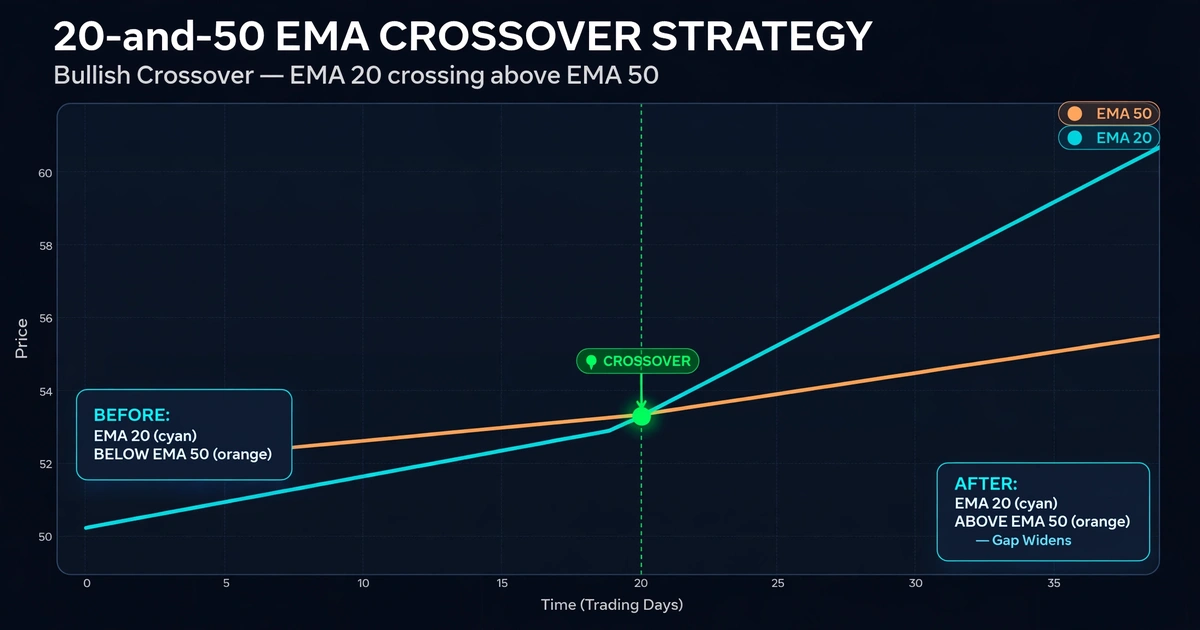
A ribbon is closer to a combination of two-line systems than a new idea. The 8/21 pair resembles the logic in the 9 and 21 EMA crossover strategy, while the 21/55 pair works at a similar scale to the 20 and 50 EMA crossover strategy. What the third line adds is a filter. You can see whether fast and slow trends agree before you act, at the cost of fewer signals and more rules to follow.
Ribbon Errors Worth Catching in Your Journal: Late Entries, Cluttered Charts, Moved Stops
- Chasing the fan. Entering when price is already far from the 21 EMA means a stop that’s too wide or a stop that’s too tight.
- Adding extra indicators. Stacking RSI, MACD, and Bollinger Bands on top of three EMAs often produces conflicting signals and hesitation.
- Ignoring the slope. A stack that’s in order but flat isn’t a trend.
- Moving the stop. Widening a stop after entry turns a planned loss into an unplanned one.
A Test Plan: Thirty Past Pullbacks, One Spreadsheet
Before risking real money, scroll back on your chosen pair and timeframe and mark 30 occasions where the ribbon was stacked and price pulled into the 8-21 zone. For each, record the entry, stop, target, result in R, and whether you would have skipped it. A small sample proves nothing about the future. It does show whether you can apply the rules consistently and whether the stop distances feel manageable. Then repeat on a demo account in live conditions, where slippage and your own hesitation show up.
Traders Who Will Probably Find This Ribbon Frustrating
This setup may not suit you if you need frequent signals, since a strict stack filter produces fewer of them. It’s also a poor match if you can’t tolerate stop-outs from sideways chop, or if you prefer to trade ranges and reversals over trends. If your account is too small to size positions precisely with a 40-pip stop, a shorter timeframe with tighter stops may be your only option, and that brings its own cost problems.
What Can Hurt: Whipsaws, Gaps, and Leverage Behind a Lagging Signal
Moving averages lag by design. The ribbon confirms a trend after it has started and keeps showing it after it has ended, so entries are never at the extreme and exits are always late. In choppy markets, you can take several small losses in a row, which is a real psychological and financial cost.
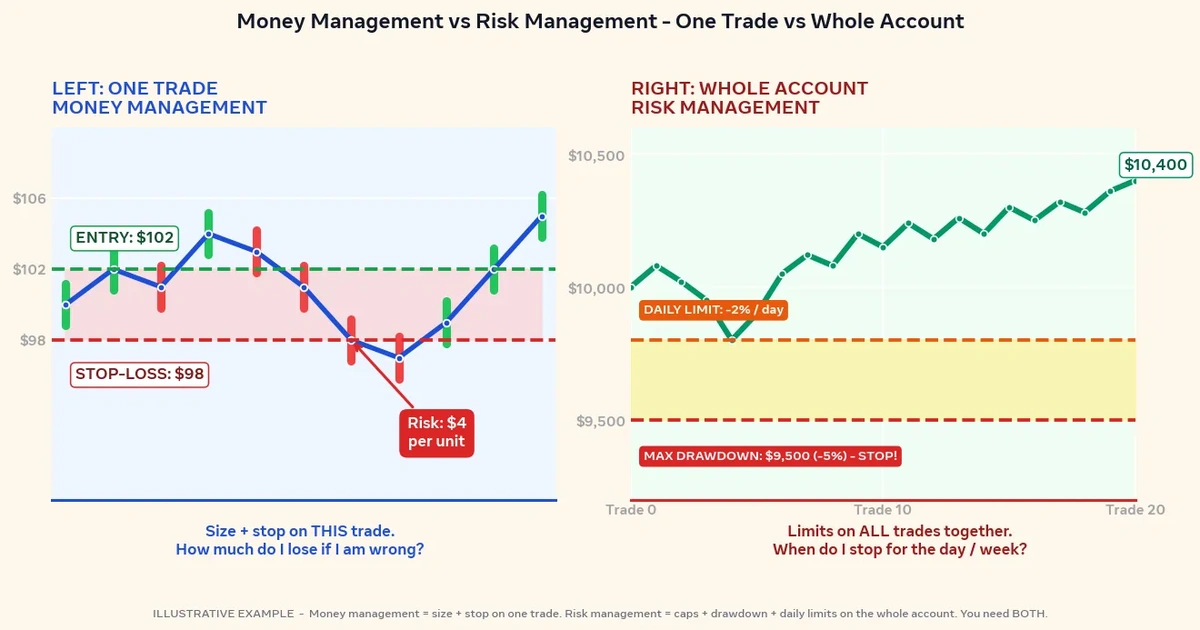
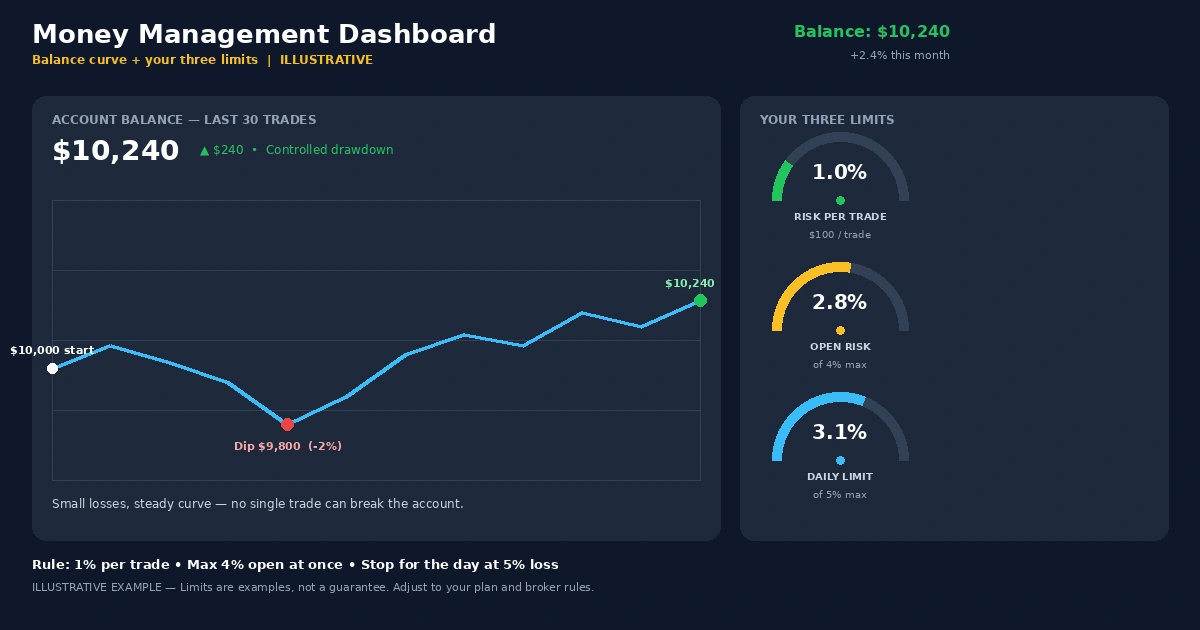
Gaps and fast news moves can jump past your stop, so the loss can exceed the planned risk. Leverage amplifies this, and a trader can lose some or all of the capital in the account. Sizing every trade as a small, fixed fraction of your account is the main protection, and the forex risk management complete guide covers that in depth. Backtests and chart reviews also tend to look better than live trading, because live execution adds spread, slippage, and emotion.
Questions Traders Ask About the 8-21-55 Setup
What does each EMA in the 8-21-55 setup do?
The 8 EMA tracks short-term momentum and helps time entries. The 21 EMA marks the pace of the working trend and often acts as a pullback area. The 55 EMA is the slow anchor, used to judge whether the larger trend is still intact and where a stop might sit.
Can beginners use this strategy?
Beginners can learn it because the rules are visual and specific, but it still demands discipline. The hard parts are waiting for a clean stack, accepting stop-outs in choppy markets, and sizing positions correctly. Practicing on a demo account first is sensible general advice.
Which timeframe should I start with?
H1 and H4 are common starting points, because spread takes a smaller share of the stop distance and the ribbon is less noisy. Lower timeframes give more signals but also more tangles and higher relative costs. Test your own pair on a few timeframes before choosing.
Do I need Fibonacci tools to use it?
No. The three periods are Fibonacci numbers, but you don’t use Fibonacci retracements or extensions to trade the ribbon. You only plot the three EMAs. Some traders combine the ribbon with other tools, though that’s optional and adds complexity.
Can I use it on gold or indices?
The mechanics apply to any liquid market with trends, but volatility, spreads, and typical stop distances differ. Gold, for example, often moves in larger ranges than major currency pairs, so you’d need to resize stops and positions accordingly. Test it separately on each instrument.
Is a pullback entry better than a crossover entry?
Neither is better in every condition. Pullback entries usually give a closer stop and better reward-to-risk, but you may miss trades that never pull back. Crossover entries trigger later and with wider stops, but they confirm that momentum has resumed. Test both on your charts.
Let the 55 Set the Direction and the 21 Set the Entry
The ribbon works best as a filter that tells you when to stand aside. A stacked, sloping fan gives you permission to look for entries. A tangled one means you do nothing. For your next step, mark the last 20 times price touched the 21 EMA while the ribbon was stacked on an H4 chart. Note which ones would have hit your stop before your target.
Disclaimer
This article is for educational purposes only and is not financial advice. Forex and CFD trading involves a high level of risk, and you can lose some or all of your capital. Leverage can magnify both gains and losses. Never trade with money you can’t afford to lose.
This is a trading framework, not a guarantee. No strategy wins every trade, and results vary with market conditions, execution, and risk management.
Any percentages or figures shown are historical averages or hypothetical examples, not guarantees. Past performance does not predict future results.
Join now
Comments (0)
Be the first to comment.