
Range Trading Explained: How to Trade Sideways Markets
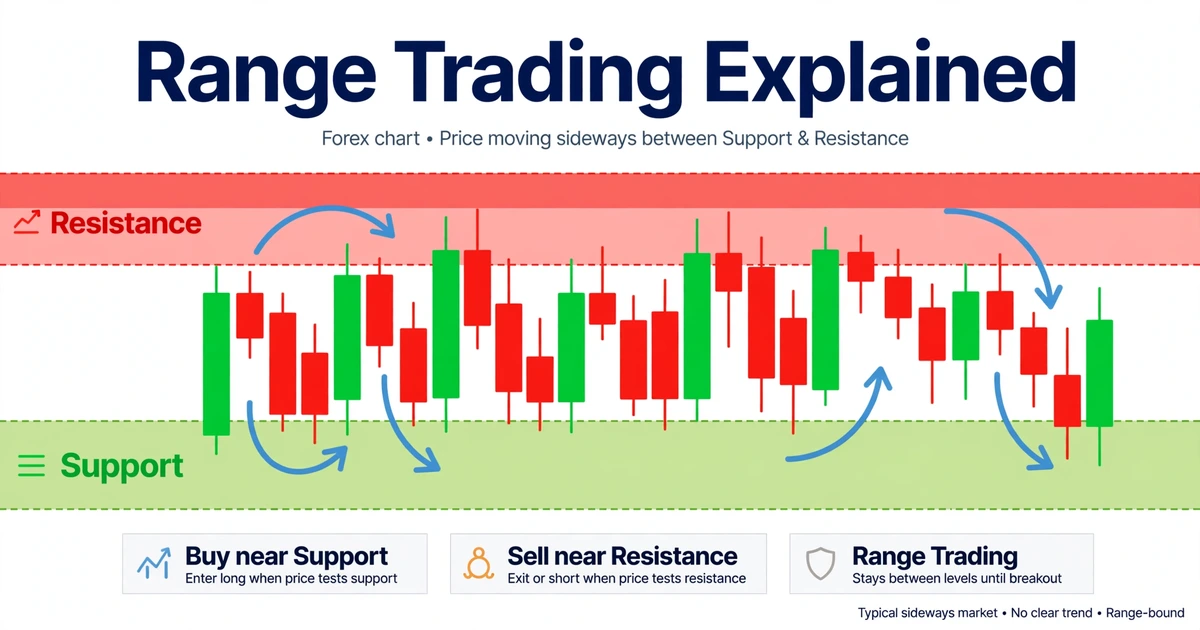
A pair touches the same ceiling, turns back, and does it again two weeks later. Breakout traders who jump in at each edge keep getting reversed. Those stretches are ranges, and range trading is the practice of buying near the floor and selling near the ceiling while price stays between them. It’s popular because the boundaries are visible and the stop has an obvious home. It also has a built-in danger: the day the range ends. What follows is a working method covering how to define the box, choose an entry, place stops, and decide in advance what you’ll do when it breaks.
Buy the Floor, Sell the Ceiling, Respect the Break
- Define the box. A range is a stretch where price repeatedly turns back from a ceiling and a floor without making progress beyond either.
- Trade the edges. Many traders look to buy near the floor and sell near the ceiling, usually after a rejection signal, with a stop just outside the box.
- Aim short. Targets are limited by the width of the range, so reward-to-risk tends to be smaller than in trend trading.
- Plan the exit from the box. Every range eventually breaks. If you haven’t decided what a break means before it happens, you’ll decide under stress.
This is a framework to test, not a guarantee.
Why Prices Stall Between Two Levels
A range forms when buying and selling pressure are roughly balanced. Buyers step in at the floor because the price looks cheap to them. Sellers step in at the ceiling because it looks expensive. Neither side has enough conviction to push through, so price oscillates.
Several situations commonly produce this balance:
- Traders are waiting for a scheduled event, such as a central bank decision, and few want to commit beforehand.
- A strong move has just ended, and the market is digesting it.
- Trading is quiet. Asian-session hours often produce narrower ranges in pairs that become active at the European open, though that’s a tendency, not a rule. Our guide to the four major forex sessions shows how activity shifts through the day. If you work with session times, confirm them in UTC and adjust for daylight saving.
A range is a temporary balance, not a permanent condition. The same chart that looks perfectly sideways for three weeks can resolve in one candle.
Drawing the Box: Boundaries as Zones, Not Lines
Finding the Edges
Start on a chart with enough history to see several turning points, such as the 4-hour or daily. Mark the area where price has turned down at least twice (the ceiling) and the area where it has turned up at least twice (the floor). Use a zone a few pips thick, not a single line, because price rarely reverses at exactly the same tick. Judging how reliable each boundary is takes a few criteria, which we cover in strong vs weak support and resistance zones.
How Many Touches Are Enough
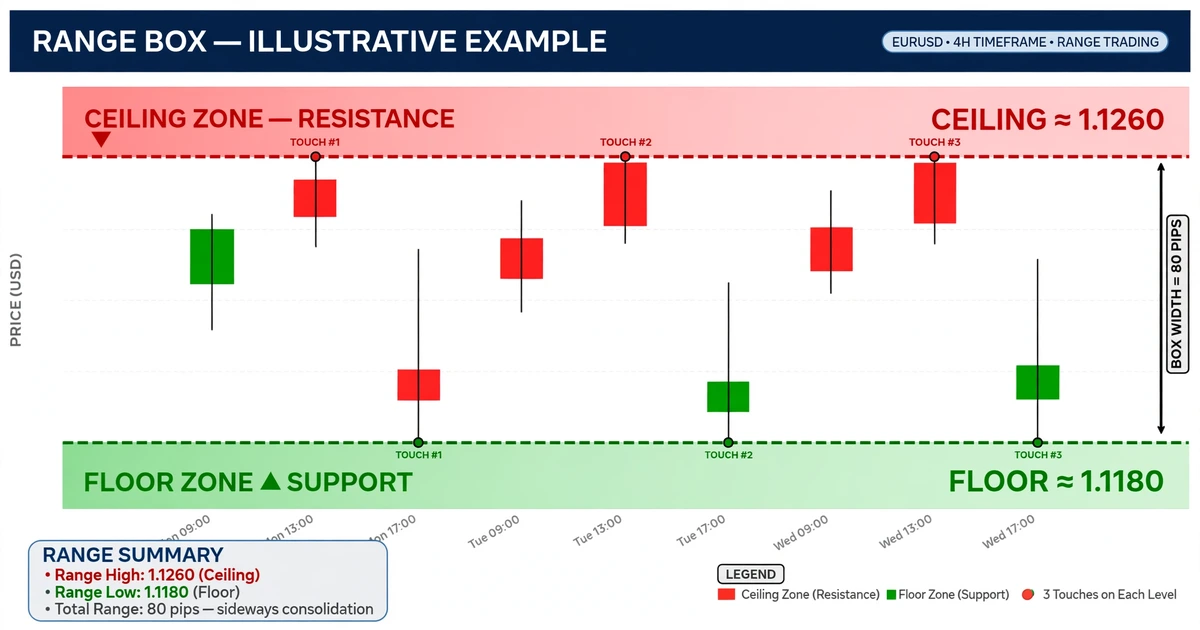
Two touches on each side is a common minimum, and more touches mean the market has agreed on those levels for longer. But an extra touch isn’t a promise. Each retest also uses up the orders waiting at that level, and many traders consider a boundary that has been hit many times in a short period more likely to give way, not less. Treat touch count as one input, not proof.
Measuring the Width
Subtract the floor from the ceiling, in pips. That number matters for two reasons. It caps your realistic reward, since you can’t expect to collect more than the distance across the box. And it tells you whether the range is worth trading at all, because a box only 25 pips wide can be eaten alive by the spread and a sensible stop.
Is It a Range or a Pause Inside a Trend?
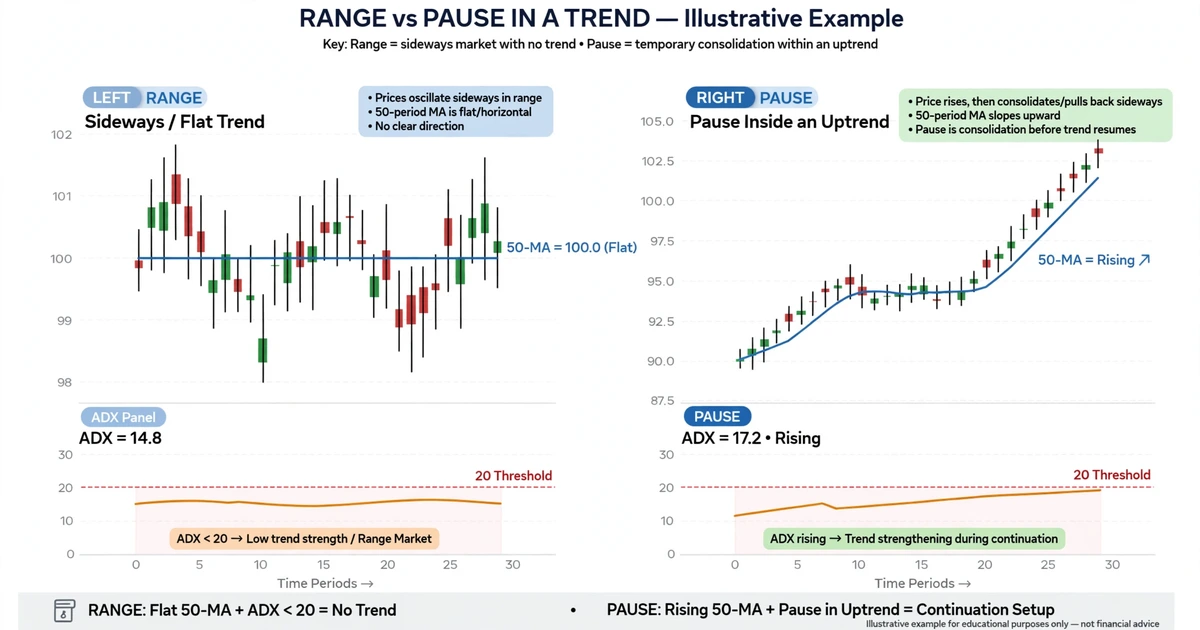
Mislabeling a pause as a range is one of the most common range trading errors, because pauses within trends often look sideways. Some checks traders use:
- Slope of a moving average. A flat 50-period average suggests no direction. A steeply tilted one suggests a trend that’s merely resting.
- ADX (Average Directional Index). This 14-period indicator measures trend strength regardless of direction. Readings below roughly 20 are commonly read as weak or no trend, though that cutoff is a convention.
- Overlapping candles. In a range, candles overlap heavily and fail to close beyond prior extremes.
- Higher timeframe context. A “range” on the 15-minute chart may be a small pause inside a strong daily trend. Check one timeframe up before you trade against the drift.
The opposite approach has the opposite needs. Trend systems want clean directional moves and suffer in boxes, which is why our guide to trend following for beginners treats sideways markets as the main enemy. Range traders face the mirror image: the box is their friend and the breakout is their risk.
Three Entry Styles, From Aggressive to Patient
| Entry style | How it works | Strength | Weakness |
|---|---|---|---|
| Fading the edge | Place a limit order at the boundary zone and sell the ceiling or buy the floor | Best price and smallest stop | No confirmation, so you’re buying into a possible breakout |
| Waiting for rejection | Enter after a rejection candle (long wick, bearish or bullish engulfing) at the edge | Some evidence that the level is holding | Worse entry price and a slightly wider stop |
| Catching the failed break | Enter after price pokes beyond the edge and closes back inside | Traps late breakout traders and gives a tight, logical stop | Fewer setups, and some “failed breaks” turn out to be the real break |
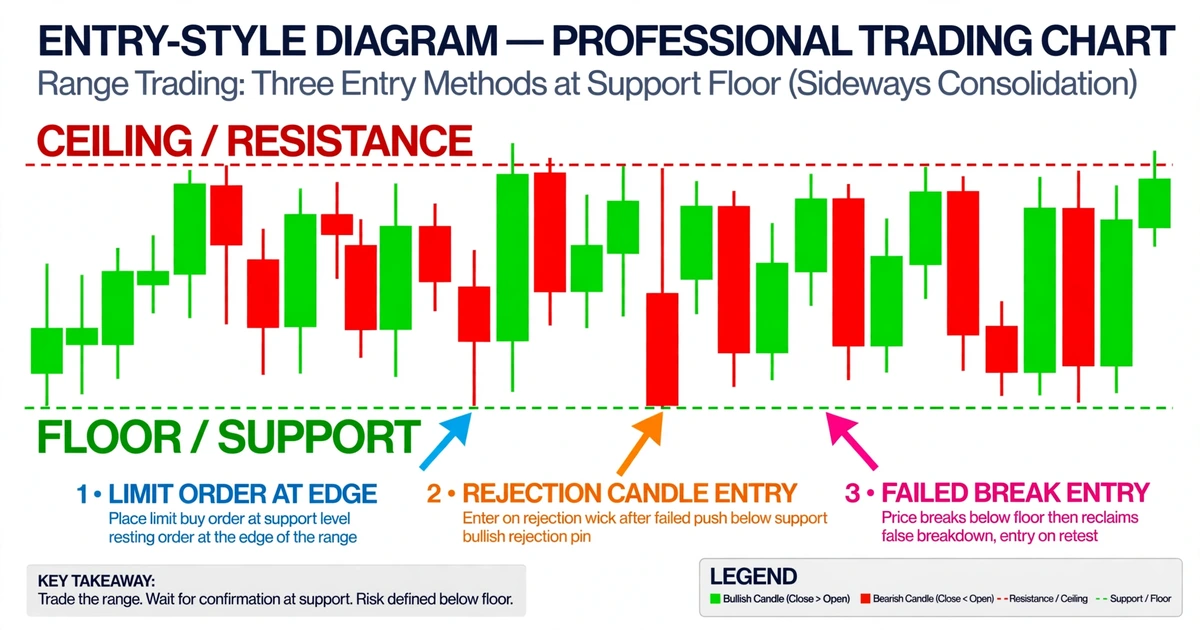
Many beginners start with rejection-based entries because the evidence is visible before risk is taken. Whichever style you pick, write it as one sentence you can’t argue with, such as “Buy only after a 4-hour candle closes back above the floor zone with a lower wick at least as long as its body.”
Oscillators such as RSI or Stochastic are common aids in ranges, with readings near the extremes treated as a sign price may turn. They’re a supporting check, not a trigger, because they can stay at extremes for a long time when a range is breaking.
Stops, Targets, and the Math of a Small Box
Stops go outside the box, beyond the edge by a buffer large enough to survive normal wicks, because a stop inside the zone is inside the noise. A buffer based on ATR (Average True Range, the typical candle range) adapts to volatility. A close beyond your stop means the range thesis has failed.
Targets usually sit at the middle of the box (a conservative target) or just inside the opposite edge (a full target). Stopping a few pips short of the far edge acknowledges that price often turns before touching the exact level.
The geometry limits reward-to-risk. In a box 120 pips wide, a trader who enters 10 pips from the floor with a 30-pip stop and targets 10 pips below the ceiling has risk of 30 pips and reward of 80. In a box 50 pips wide, the same buffer leaves a reward that may barely exceed the risk. Skip boxes where the math doesn’t work.
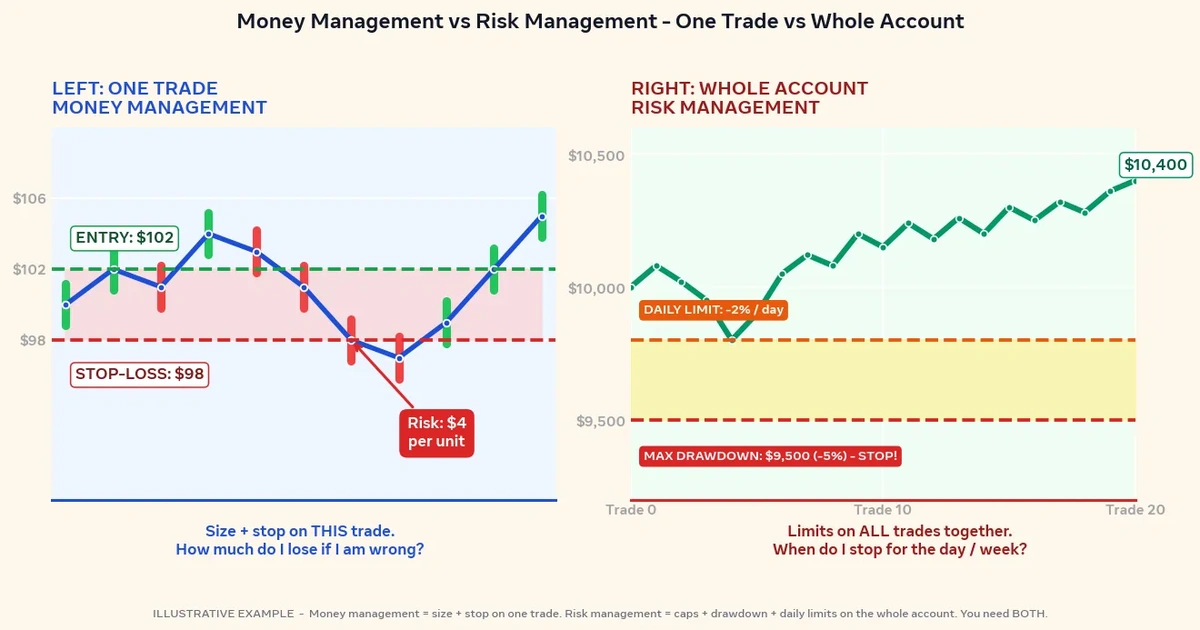
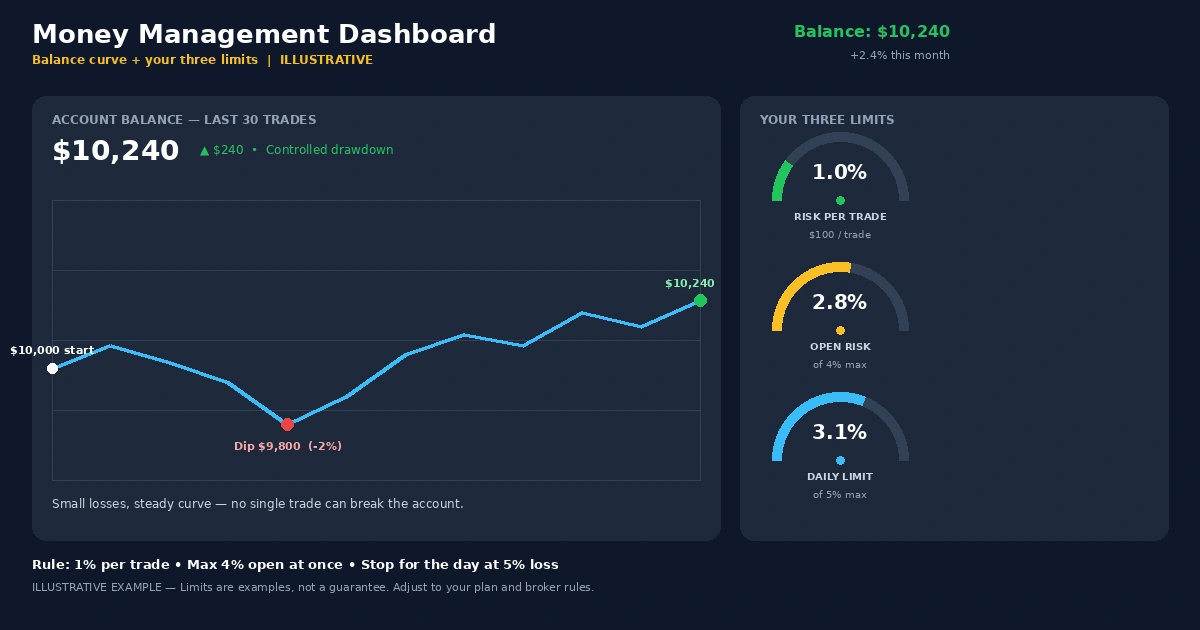
The spread eats into narrow ranges, since a one-pip spread on a 20-pip target is a 5% haircut before anything goes wrong. Commissions and slippage add to it. Our forex risk management guide goes deeper on sizing positions from the stop distance.
A 4-Hour USD/CAD Box, Traded From the Floor
Imagine USD/CAD has been oscillating on the 4-hour chart between a floor zone near 1.3480 and a ceiling zone near 1.3600, a 120-pip box. It has touched the floor three times and the ceiling three times. The 50-period average is flat and ADX reads 17. A trader with a $4,000 account risks 0.5% ($20) per trade.
Price drops into the floor zone again. A 4-hour candle prints a long lower wick and closes at 1.3490.
This is a hypothetical example for illustration only.
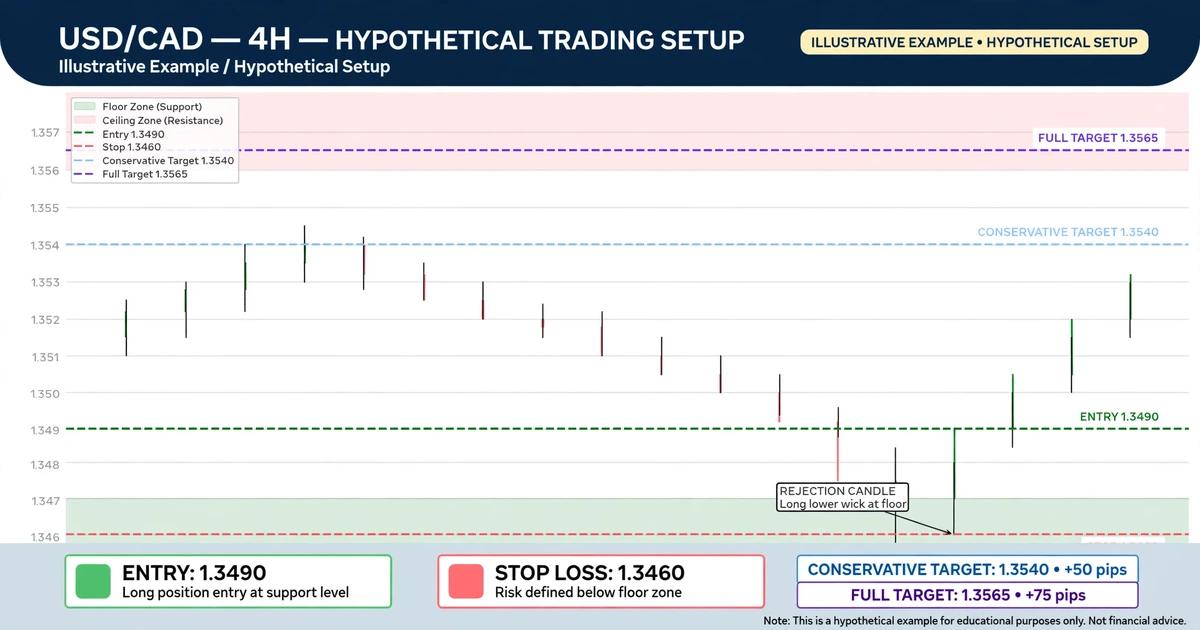
The plan:
- Entry is a long at 1.3490.
- The stop is at 1.3460, 30 pips below entry and below the floor zone, for 30 pips of risk.
- The target is 1.3565, just below the ceiling zone, for 75 pips of reward, a 2.5:1 ratio.
The sizing: USD/CAD is quoted in Canadian dollars, so pip value must be converted into the account currency. One pip is 10 CAD per standard lot. At 1.3490, that’s 10 ÷ 1.3490 = $7.41 per pip, per lot. Position size is $20 ÷ (30 pips × $7.41) = 0.09 lots, which rounds down to 0.08 lots. Actual risk is 0.08 × 30 × $7.41 = $17.79. A full-target gain would be 0.08 × 75 × $7.41 = $44.48. A one-pip spread costs about $0.59 at this size.
What the plan says about the middle: A conservative target at the middle of the box, around 1.3540, would be 50 pips, a 1.67:1 ratio. Taking profit there would raise the hit rate but shrink the reward.
How it can go wrong: A 4-hour close below 1.3460 means the range has broken, and the loss is about $17.79. Price can also stall mid-box and never reach either target, or hit the stop on a news spike before reversing, in which case the idea was fine and the stop was simply too tight for that event.
After the Box Breaks: What Your Plan Should Already Say
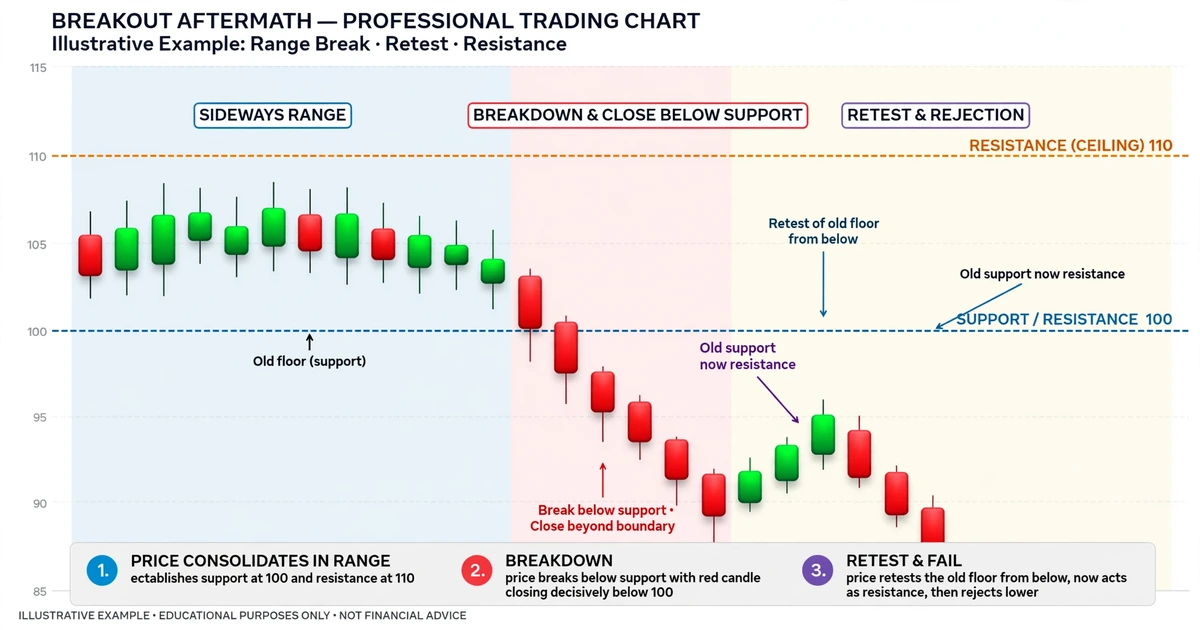
Ranges end. Often the end looks like a small, ordinary candle at the boundary, which is why the response has to be decided beforehand.
- Accept the stop. If price closes beyond the zone and hits your stop, the trade is over. Don’t widen the stop, and don’t add to the position hoping it comes back.
- Wait for a close, not a wick. Many traders require a candle close beyond the boundary before treating it as a genuine break, because wicks through a level are common and often reverse.
- Look for a retest. After a real break, price often returns to test the old boundary from the other side. A boundary that failed as support can become resistance.
- Treat any breakout trade as a new trade. If you join the break, it needs its own entry, stop, and size, rather than being a way to recover the last loss.
- Watch for expansion. A sudden rise in candle size, or in ATR, after a long quiet stretch signals the balance has changed.
Short Targets, Quiet Charts: Matching the Method to the Person
Range trading tends to suit traders who are comfortable with small, repeatable gains, can accept being wrong at the edge quickly, and are willing to skip days when no clean box exists. Watching charts a few times a day is enough on the 4-hour timeframe.
It’s a harder fit for traders who get restless without a trade, since forcing setups in doubtful ranges is a classic way to lose money. It also suits poorly anyone who tends to widen stops after a loss, because a broken range punishes exactly that habit. If you’re still deciding what style fits your schedule, our guide on how to choose your trading style is a useful companion.
Hoping the Wall Holds: Five Errors Range Traders Repeat
- Trading the middle of the box. Entries in the center have no nearby stop and no edge, and they leave both ends of the range as danger zones.
- Calling a range after one bounce. A single reversal isn’t a range. Wait for repeated turns on both sides.
- Using a stop inside the zone. A stop sitting within normal wick distance of the edge gets hit repeatedly by noise.
- Treating the third or fourth retest as extra-safe. More touches can mean weaker boundaries, since resting orders get consumed.
- Trading a range right before a scheduled event. Ranges often form because the market is waiting, and the event can end the wait in one candle.
- Ignoring the higher timeframe, such as buying the floor of a 1-hour box that sits inside a strong daily downtrend.
A Range Is Only a Range Until It Breaks
- The breakout asymmetry. Range trading often produces frequent small gains and an occasional large loss. In a hypothetical run of ten trades, seven winners of +1R and three losers of −1R total +4R. If one of the losing trades runs to −3R because the stop was widened, the total drops to +2R (7 − 1 − 1 − 3). A single undisciplined loss can cancel several winners.
- News spikes and gaps. A scheduled release or a surprise headline can push straight through a boundary and your stop. Weekend gaps can open beyond it, and the fill can be worse than planned (slippage), so the loss may exceed what you intended to risk.
- Narrow boxes and costs. In small ranges, the spread, commissions, and slippage can consume a large share of the potential gain.
- Leverage. Leverage magnifies losses as well as gains, and a series of stopped trades at a broken range can use up capital quickly if size isn’t controlled.
- Hindsight bias. Ranges look obvious on a finished chart. In real time, you often can’t tell a range from the start of a trend until it’s over.
- Overtrading. Because ranges offer frequent setups, it’s easy to take marginal ones, and each carries its own spread and risk.
What Range Traders Wonder About Before the First Trade
Is range trading good for beginners?
It’s often recommended because the idea is simple and the stop has a clear location. But it requires patience and discipline, especially around breakouts. Beginners usually do better with a demo account, one pair, one timeframe, and a written rule for what happens if the range breaks. The method is easy to understand and still easy to get wrong.
How do I know a range is about to break?
You usually can’t know in advance. Common warning signs include repeated tests of one boundary in a short time, a rising ATR after a quiet stretch, higher lows pressing up against a ceiling, and an approaching major news release. Treat these as reasons to reduce size or stay out, not as predictions of direction.
What timeframe works best for range trading?
There’s no single answer. The 4-hour and daily charts give cleaner boundaries and wider boxes, which suit larger stops and reduce the impact of spread. Lower timeframes offer more setups but have narrower boxes and more noise. Choose a timeframe where the box is wide enough, relative to the spread, to give a workable reward-to-risk ratio.
Which indicators work in a range?
Oscillators such as RSI, Stochastic, and Bollinger Bands are commonly used because they highlight stretches toward the box edges. None of them is reliable alone. They can stay at extreme readings while a breakout runs. Many traders treat them as a secondary check on top of price and candle evidence at the boundary.
Can I use range and trend strategies together?
Yes, though the key is knowing which environment you’re in. Some traders use a trend method when the market is trending and a range method when it isn’t, deciding with a simple tool such as a flat average or low ADX. The difficulty is that the switch is clear only after the fact, so keep risk small during transitions.
The Edge of the Box Is Where the Plan Lives
Range trading rewards precision at the edges and punishes vagueness about the exit. Everything useful here comes down to deciding, before you enter, where you’re wrong and what you’ll do when the box ends. For your next step, find a pair that has been moving sideways on the 4-hour chart, mark the floor and ceiling zones, and write a one-line break rule. When you want a simpler rule set to practice with, continue to range trading for beginners.
Disclaimer
This article is for educational purposes only and is not financial advice. Forex and CFD trading involves a high level of risk, and you can lose some or all of your capital. Leverage can magnify both gains and losses. Never trade with money you can’t afford to lose.
This is a trading framework, not a guarantee. No strategy wins every trade, and results vary with market conditions, execution, and risk management.
Any percentages or figures shown are historical averages or hypothetical examples, not guarantees. Past performance does not predict future results.
Join now
Comments (0)
Be the first to comment.