
Range Trading for Beginners: A Complete Guide
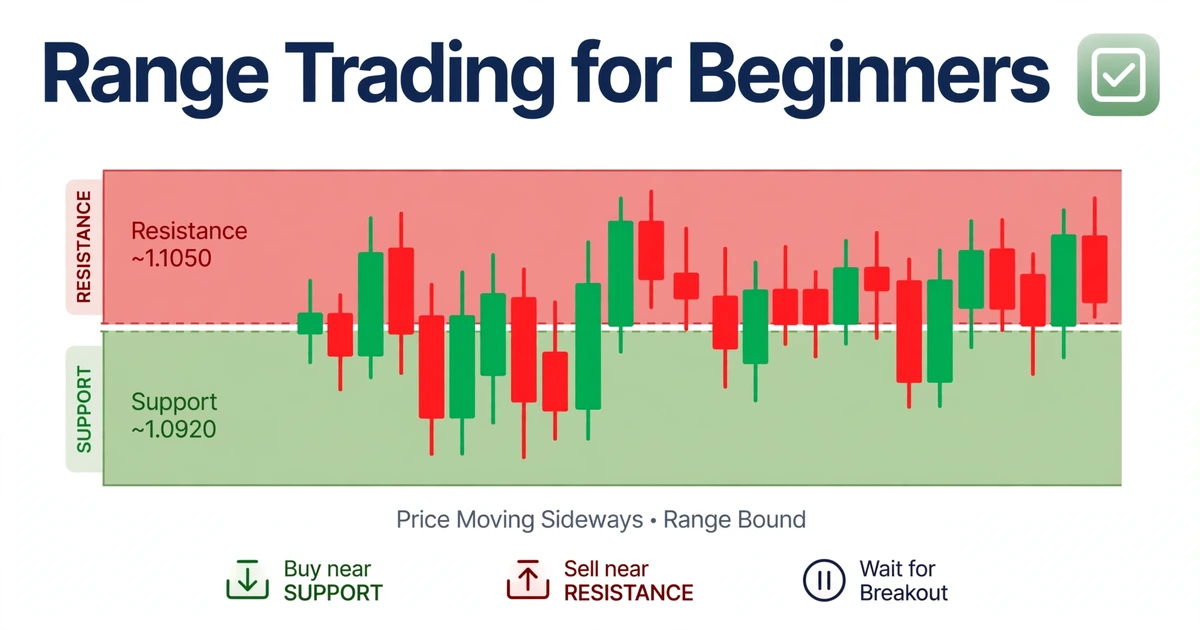
Open a daily chart of almost any major pair and you’ll find stretches, sometimes weeks long, where price goes nowhere in particular. Beginners tend to skip those stretches and hunt for a trend instead. Range trading for beginners starts from the opposite idea: a market that keeps bouncing between two levels gives you two clear places to act and a natural place to be wrong. This guide builds a complete first system, from drawing the box to placing the stop, sizing the position, and writing down what you’ll do when the box finally breaks.
A Sideways Market in Brief: Edges In, Middle Out
- A range is a stretch where price turns back from a floor (support) and a ceiling (resistance) that have each held at least twice.
- A beginner-friendly plan trades only the edges: wait for a rejection candle at one edge, put the stop just outside the box, and aim for the middle of the box or a little beyond.
- Before trading, run three checks: flat slope, reactions at both edges, and a higher timeframe that isn’t strongly trending.
- Size the position from the stop distance, risk a small fixed amount, and write your breakout rule before the first trade.
- It’s a framework to test on a demo account, not a guarantee.
Sideways Price in Plain English: Floor, Ceiling, and the Space Between
Support is a price area where buyers have repeatedly stepped in and stopped a decline. Resistance is an area where sellers have repeatedly stopped a rally. When both hold for a while, price moves back and forth between them like a ball in a hallway. Traders call the space between the two levels a range or a box.
The box is measured in pips. A pip is the standard unit of price movement, usually 0.0001 on most pairs and 0.01 on yen pairs. If a ceiling sits at 1.0790 and a floor at 1.0720, the box is 70 pips wide. That number matters, because it limits how far a trade inside the box can realistically travel.
Ranges happen when buying and selling pressure are roughly balanced. Traders may be waiting for a data release, digesting a big move, or trading during a quiet session. A range is a temporary balance, not a permanent condition, and the same chart that looks flat for three weeks can break out in a single candle.
The Appeal of Ranges and the Catch Behind It
New traders like ranges for good reasons. The levels are visible, the stop has an obvious home just outside the box, and setups appear often enough to practice on.
The catch is that rewards are capped by the box width, while a breakout can hurt more than any single bounce pays. A range also looks obvious on a finished chart and is much harder to recognize live. Our companion piece, range trading explained, compares several entry styles in more depth. Here, the goal is a single, simple rule set you can practice start to finish.
Marking Your First Box: A Pencil-Then-Ink Method
Pencil: Find the Turning Points
Open the daily or 4-hour chart, since slower timeframes give cleaner boundaries and wider boxes. Scroll back until you can see at least two turns down from a similar high and two turns up from a similar low. Draw a thin horizontal line through each pair. These are your pencil lines, provisional until they pass the tests in the next section.
Ink: Turn Lines Into Zones
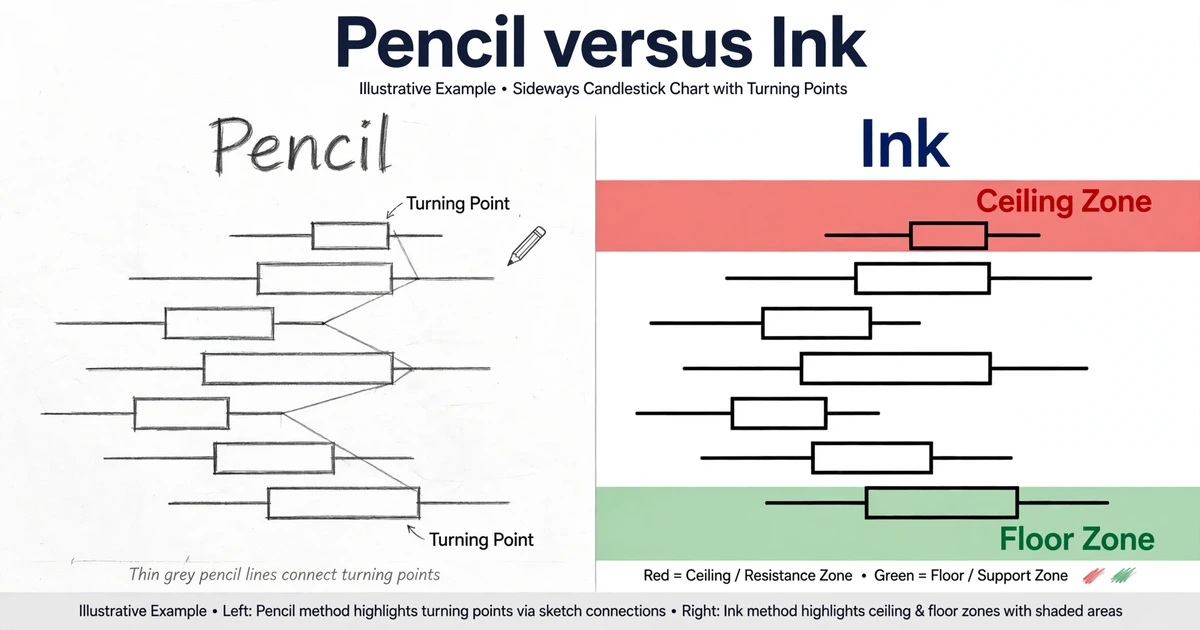
Price rarely reverses at exactly the same tick, so thicken each line into a zone that covers where the turning points actually landed. Decide once whether you’ll measure from wicks or from candle bodies, and keep that rule. Judging how reliable a zone is takes a few criteria, which we cover in our guide to strong vs weak support and resistance zones.
Then measure the box width in pips and compare it with the stop you expect to use. A workable rule of thumb to test is that the box should be at least about three times your stop distance. If it’s narrower, the target can’t pay a worthwhile multiple of the risk once spread and slippage are counted.
The Three-Question Test Before You Trust a Box
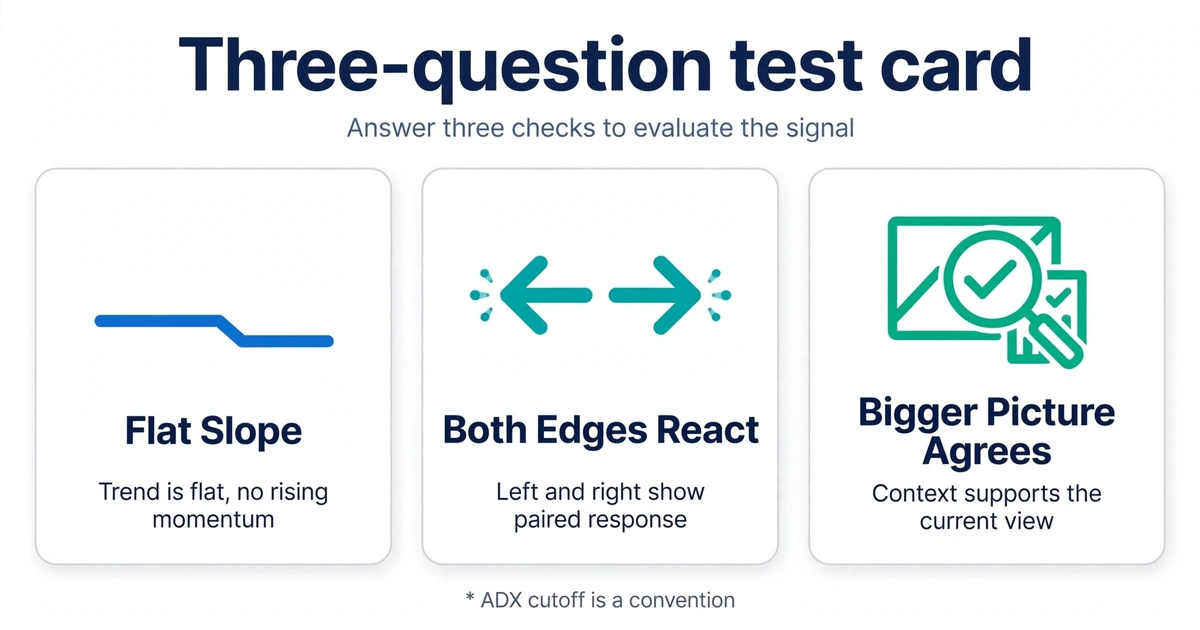
Pencil lines are only a hypothesis. Run these checks before you trade anything.
1. Is the slope flat? A 50-period moving average that’s roughly horizontal suggests no direction. The Average Directional Index (ADX), a 14-period indicator that measures trend strength regardless of direction, reading below roughly 20 is a common sign of a weak trend. That cutoff is a convention, not a law.
2. Do both edges react? Look for clear turns from the ceiling and the floor. A box that has held three times at the floor but only once at the ceiling is probably a market leaning in one direction.
3. Does the bigger picture agree? Zoom out one or two timeframes. If the daily chart shows a strong trend and your “range” lives on the 1-hour chart, it may be a pause inside that trend, which tends to break in the trend’s direction.
Add one quick glance at the economic calendar. Ranges often form because the market is waiting, and a major release can end the wait in one candle.
Starting With One Entry Rule: Wait for the Rejection Candle
Pick one entry rule and use it for weeks. A good beginner rule is the rejection candle, a candle that pokes into or beyond an edge and then closes back inside the box, leaving a long wick that shows the move was refused.
| Short at the ceiling | Long at the floor | |
|---|---|---|
| Location | High pokes into or just above the ceiling zone | Low pokes into or just below the floor zone |
| Shape | Upper wick at least as long as the body | Lower wick at least as long as the body |
| Close | Back inside the box, below the ceiling zone | Back inside the box, above the floor zone |
| Entry | At that candle’s close | At that candle’s close |
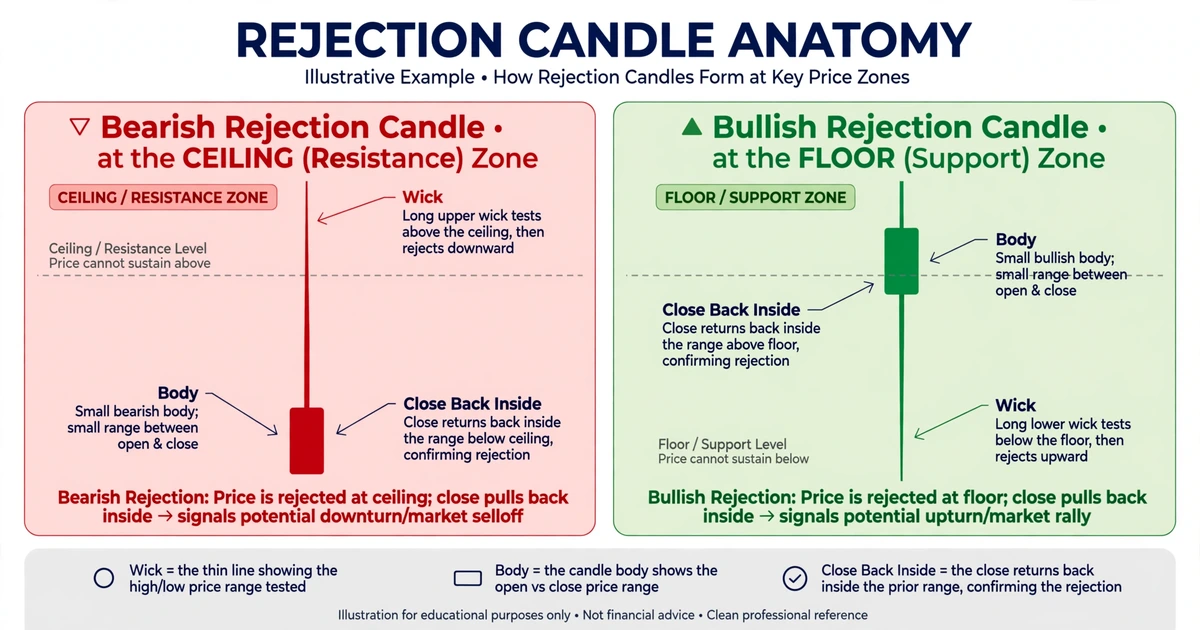
Waiting for the close gives you evidence before you take risk, at the cost of a slightly worse entry price than fading the edge with a limit order. Some traders add an oscillator such as the Relative Strength Index (RSI), which scales recent gains against losses from 0 to 100, and look for readings near the extremes. Treat it as an optional second opinion. Oscillators can stay at extremes for a long time when a range is breaking.
Sizing the Trade From the Stop, Not From Your Hopes
The stop goes just outside the box, beyond the zone by a buffer large enough to survive ordinary wicks. A stop sitting inside the zone gets hit by noise. If the price closes beyond your stop level, the range idea has failed, and the trade is simply over.
The target can start simple: the middle of the box is a conservative target, and a level just inside the opposite zone is a full target. Many price reversals stall a few pips short of the exact level.
Then work backward from the stop to the position size:
Lots = dollars at risk ÷ (stop distance in pips × pip value per lot)
A standard lot is 100,000 units of the base currency, a mini lot is 10,000, and a micro lot is 1,000. On a pair quoted in US dollars, with a USD account, a pip is worth $10 per standard lot, or $0.10 per micro lot. On other pairs, pip value depends on the pair and your account currency, so recalculate it every time.
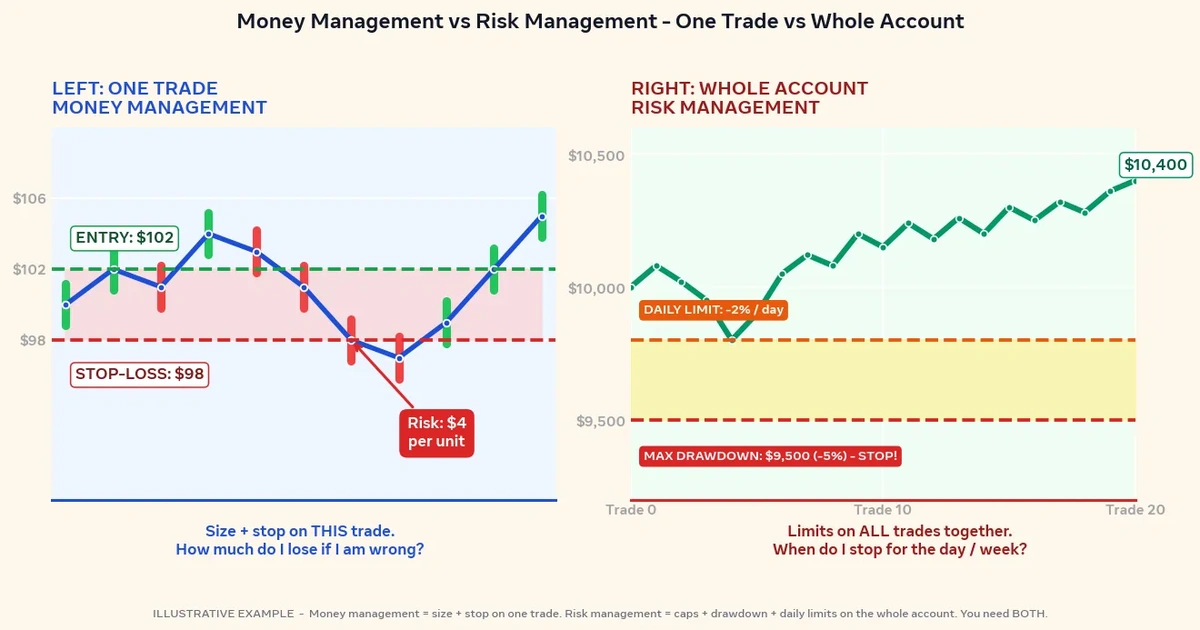
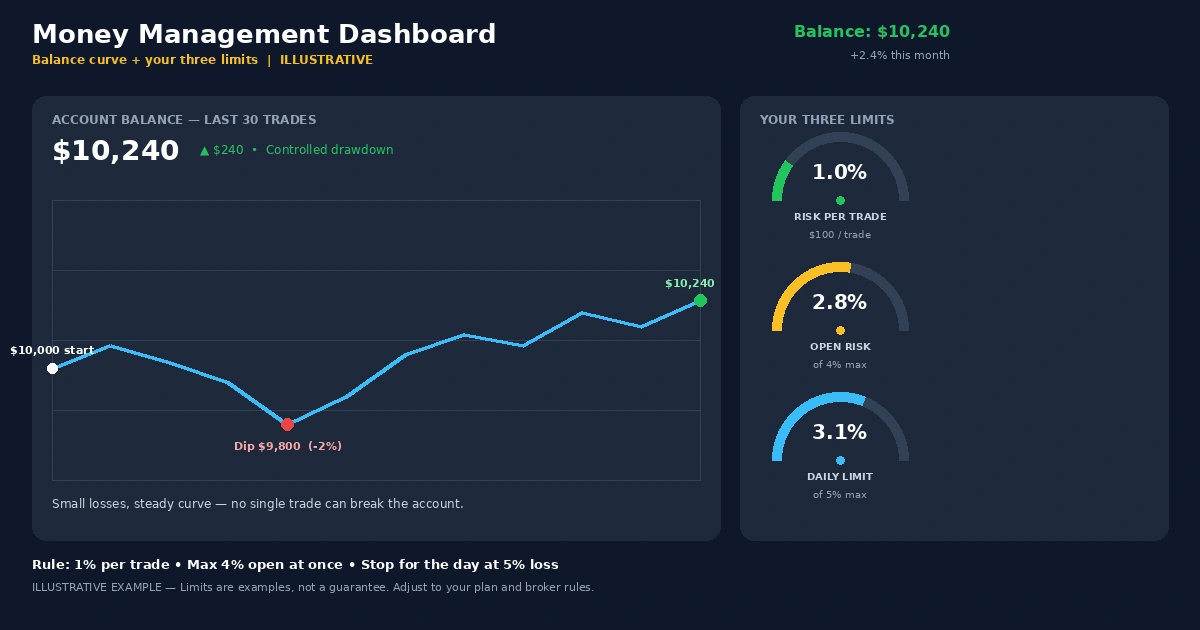
Many educators suggest keeping the risk per trade small, often 1% of the account or less. The right level depends on your situation. Our forex risk management guide covers sizing and loss limits in more depth.
Ceiling Short on a 70-Pip Box: The Checklist in Action
Imagine a trader with a $2,500 USD account who risks 1% ($25) per trade. EUR/USD has been moving sideways on the 1-hour chart. The ceiling zone is near 1.0790 and the floor zone near 1.0720. Here’s how the checks come out:
| Check | What the chart shows | Result |
|---|---|---|
| Flat slope | 50-period average flat, ADX at 16 | Pass |
| Edge reactions | Ceiling turned price three times, floor three times | Pass |
| Bigger picture | Daily chart also moving sideways | Pass |
| Width versus stop | 70-pip box, planned stop of 18 pips (about 3.9 times the stop) | Pass |
| Calendar | No major release for the next several hours | Pass |
| Trigger | 1-hour candle with a high of 1.0793 and a long upper wick, closing at 1.0782 | Pass |
This is a hypothetical example for illustration only.
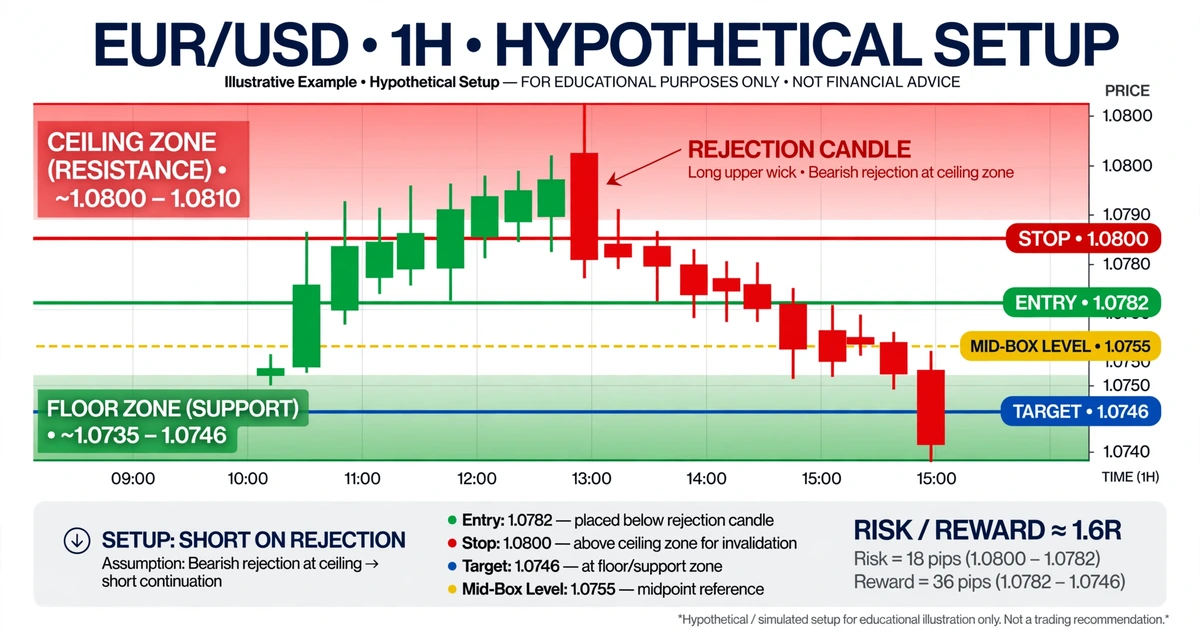
The plan: Enter short at 1.0782. Place the stop at 1.0800, above the candle high and the zone, which is 18 pips of risk. Place the target at 1.0746, which is 36 pips of reward, a 2:1 ratio. The middle of the box sits at 1.0755, so the target is a little beyond it and still above the floor zone.
The sizing: EUR/USD is quoted in dollars, so a pip is worth $10 per standard lot. Position size is $25 ÷ (18 pips × $10) = 0.139 lots, which rounds down to 0.13 lots. That makes a pip worth $1.30. Planned risk is 18 × $1.30 = $23.40, or about 0.94% of the account. A full-target gain would be 36 × $1.30 = $46.80. A one-pip spread costs about $1.30 at this size.
Three ways it can end:
- Stopped out. Price closes above 1.0800, and the loss is $23.40.
- Target reached. Price falls to 1.0746 for $46.80.
- Middle of the box. If the trader exits at 1.0755 instead, the gain is 27 pips × $1.30 = $35.10, which is a 1.5:1 ratio.
Price can also drift in the middle of the box for hours and never reach either level, or spike through the stop on a news release before reversing. Neither outcome means the rules were broken.
Five Charts to Skip, Even When They Look Tempting
- A box too narrow for your stop. If the width is less than about three times the stop, the math doesn’t support a decent reward.
- A box with one touch on a side. A single reaction at the ceiling isn’t a ceiling yet.
- A sideways stretch right before a major release. The box may be nothing more than the market holding its breath.
- A sloped channel treated as a flat range. If both edges are tilting, the “floor” is likely to be broken in the direction of the slope.
- A quiet-session box on a pair with a wide spread. When the spread takes a big share of the box, the trade starts with a handicap.
Skipping a chart isn’t a missed opportunity. It’s one of the few free decisions a beginner can make.
Writing the Breakout Rule Before You Need It
Every range ends eventually, usually with an unremarkable candle at the boundary. Decide your response while you’re calm. A fill-in template works well:
If a ___ candle closes beyond ___, then the range idea is dead. I will ___, and I will not ___ for the next ___ candles.
For example: “If a 1-hour candle closes beyond my stop level, I take the loss, I don’t re-enter against the break, and I don’t widen the stop to give it room.” Beginners often forget the last clause, since the urge to jump back in straight after a stop-out is strong.
Many traders require a candle close beyond a boundary before calling it a real break, because wicks through a level are common and often reverse. What happens after a break is a different game. When you’re ready to study it, trend methods are the next place to look.
Four Weeks of Demo Practice, Week by Week
| Week | Focus | What you hand in to yourself |
|---|---|---|
| 1 | Mark boxes on past charts of three pairs and run the three-question test. No trading. | A screenshot folder with each box and its test result |
| 2 | Take only the rejection-candle entry on one pair on a demo account. | A log of every setup, including skipped ones |
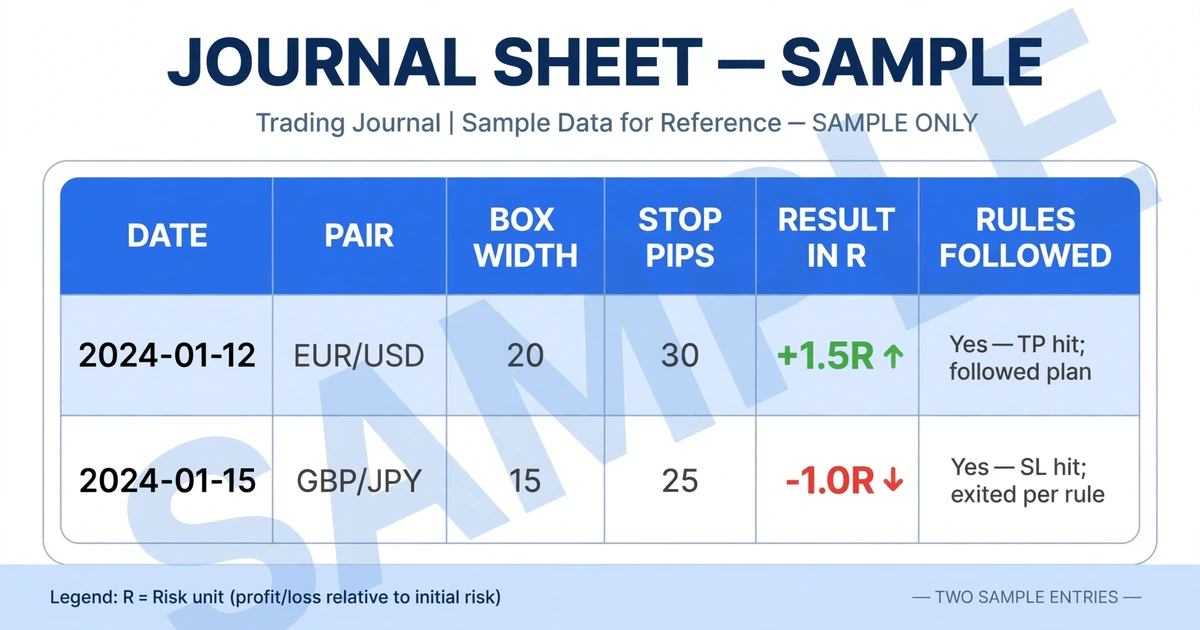
| 3 | Add position sizing and a written breakout rule. | A journal row for every trade with these columns: date, pair, box width, stop pips, result in R, rules followed (yes/no) |
| 4 | Review. | Counts of trades, average result in R, and how often you broke your own rules |
R is a way of measuring a trade’s result in units of the amount you risked: a $23.40 loss on a $23.40 risk is −1R, and a $46.80 gain is +2R. Thirty or so trades is a small sample, so treat the results as clues rather than proof. Conditions will change.
Six Slip-Ups That Show Up in Almost Every First Range Journal
- Redrawing the box after a break so that it “still holds.” Moving the lines after the fact hides the failure that the journal is supposed to record.
- Doubling size after a stop-out to win it back. That turns an ordinary loss into a larger one.
- Pushing the target outward once price gets close. The target was set when you were calm, so trust it.
- Leaving orders live at both edges and forgetting one when a news release arrives.
- Taking every pair that looks sideways at once. If EUR/USD, GBP/USD, and AUD/USD all range against the dollar, that can be one large bet in disguise.
- Practicing only on finished charts, where every range looks obvious. Forward-test on a demo account to find out how it feels live.
Costs and Cracks: Spread, Slippage, and Broken Boxes
- Spread eats small targets. A one-pip spread on a 36-pip target takes about 2.8% of the reward on every trade. Treating the spread as one pip against you, the example’s effective risk is about 19 pips and reward about 35 pips. The break-even win rate then rises from 33.3% (18 ÷ 54) to about 35.2% (19 ÷ 54), before commissions.
- Slippage and gaps. A scheduled release or surprise headline can jump past your stop. Weekend gaps can open beyond it. The fill can be worse than planned, so the loss may be bigger than the amount you intended to risk.
- Leverage. Leverage magnifies losses as well as gains, and a run of stopped trades on a leveraged account can use up capital faster than most beginners expect.
- Broken boxes. Range trades often feel comfortable until the one that doesn’t. A stop that’s widened to avoid a loss can turn a planned 1% risk into something much larger.
- Hindsight bias. Boxes drawn on past charts look cleaner than they were in real time, because you already know where they ended.
- Boredom trading. Because ranges offer frequent setups, it’s tempting to take marginal ones, and each carries its own spread and risk.
Choosing Range Trading as a First Strategy: Fit and Misfit
Range trading tends to suit people who like clear levels, can accept small, quick losses, and are willing to skip days when no clean box exists. On the 4-hour chart, a few check-ins a day can be enough.
It’s a harder fit if you get restless without a trade, if you tend to move stops after a loss, or if your account is so small that the minimum lot size breaks your risk limit. None of that is a character flaw. It’s information about which style to start with, and our guide on how to choose your trading style can help you work through it.
Newcomer Questions About Trading Sideways Markets
Is range trading easier than trend trading?
Not necessarily. Range trading has clearer stop locations, which many beginners find reassuring. But it demands patience at the edges and strict discipline around breakouts, and a broken range can erase several small gains. Neither style is easy. The better question is which one you can follow consistently on a demo account.
How long does a forex range last?
There’s no fixed duration. Some ranges last a few hours, others last weeks or months, and the same box can break at any moment. Ranges often end around major news or session changes, but you can’t reliably time the exact day. That’s why the breakout rule and the stop matter more than any forecast of how long the box will hold.
Should I trade both the ceiling and the floor?
Beginners often do better starting with one edge until the entry rule feels automatic, then adding the other. Trading both from the start doubles the decisions and the chances of forgetting an open order. Whichever you choose, each trade needs its own stop and size, and combined open risk should stay within the limit you set.
What if price breaks my box right after I enter?
Let the stop do its job. If the price closes beyond your stop level, the idea is wrong, and the plan said so in advance. Don’t widen the stop or add to the position. Record the trade in your journal, wait for a new setup, and review whether the three-question test should have caught a warning sign.
Which pairs range the most?
No pair ranges permanently, and the behavior changes over time. Pairs with lower volatility often spend more time moving sideways, but that’s a tendency, not a rule. Check the spread, the box width, and the recent behavior of the specific pair on your chosen timeframe before relying on any assumption.
Learn the Box on Paper First
A range gives you a clear place to enter and a clear place to be wrong, and a beginner’s job is to treat both seriously. This week, find three sideways stretches on historical 4-hour charts, mark each box, and run the three-question test, writing down which ones fail. When your box rules feel routine, read trend trading explained to see what the market looks like on the far side of a breakout.
Disclaimer
This article is for educational purposes only and is not financial advice. Forex and CFD trading involves a high level of risk, and you can lose some or all of your capital. Leverage can magnify both gains and losses. Never trade with money you can’t afford to lose.
This is a trading framework, not a guarantee. No strategy wins every trade, and results vary with market conditions, execution, and risk management.
Any percentages or figures shown are historical averages or hypothetical examples, not guarantees. Past performance does not predict future results.
Join now
Comments (0)
Be the first to comment.