
5 and 13 EMA Crossover Trading Strategy
On a five-minute chart, thirteen candles is a little over an hour of price action, and five candles is barely twenty-five minutes. That is the time frame the 5 and 13 EMA crossover strategy lives in. It produces many signals, reacts quickly to every burst of momentum, and punishes sloppy costs and sloppy discipline just as quickly. Below you’ll find how the cross works, a rule set you can test, a fully priced hypothetical trade, the break-even arithmetic, and an honest account of where fast crossovers lose money.
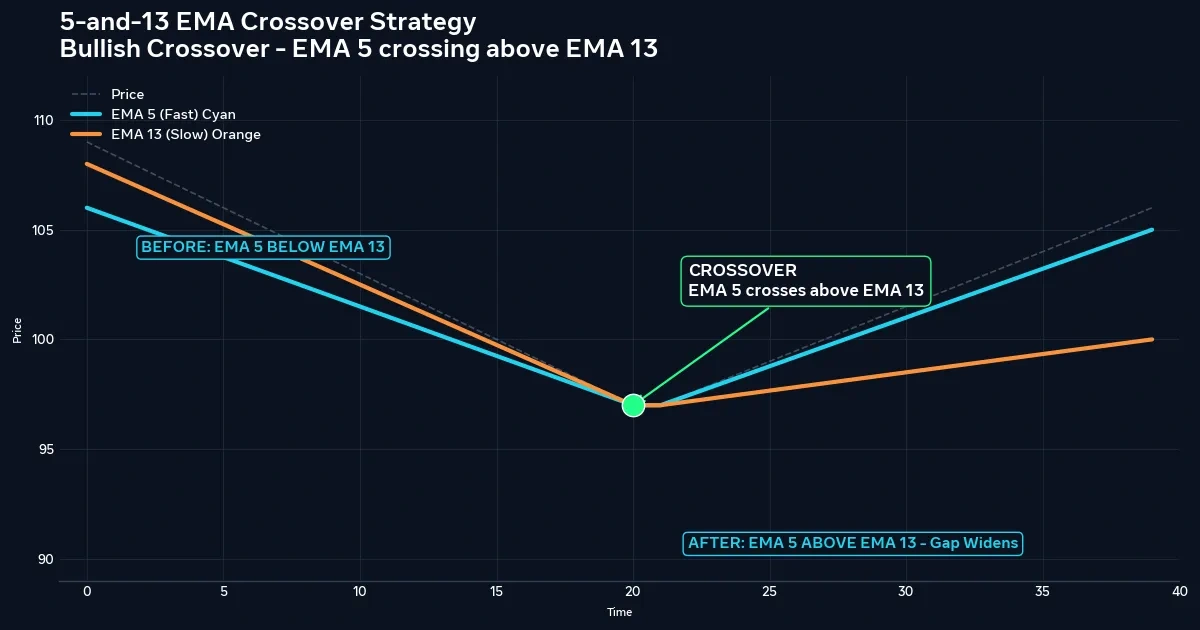
What Happens When the 5 EMA Crosses the 13
- An EMA (exponential moving average) averages closing prices while giving the newest candles more weight than older ones.
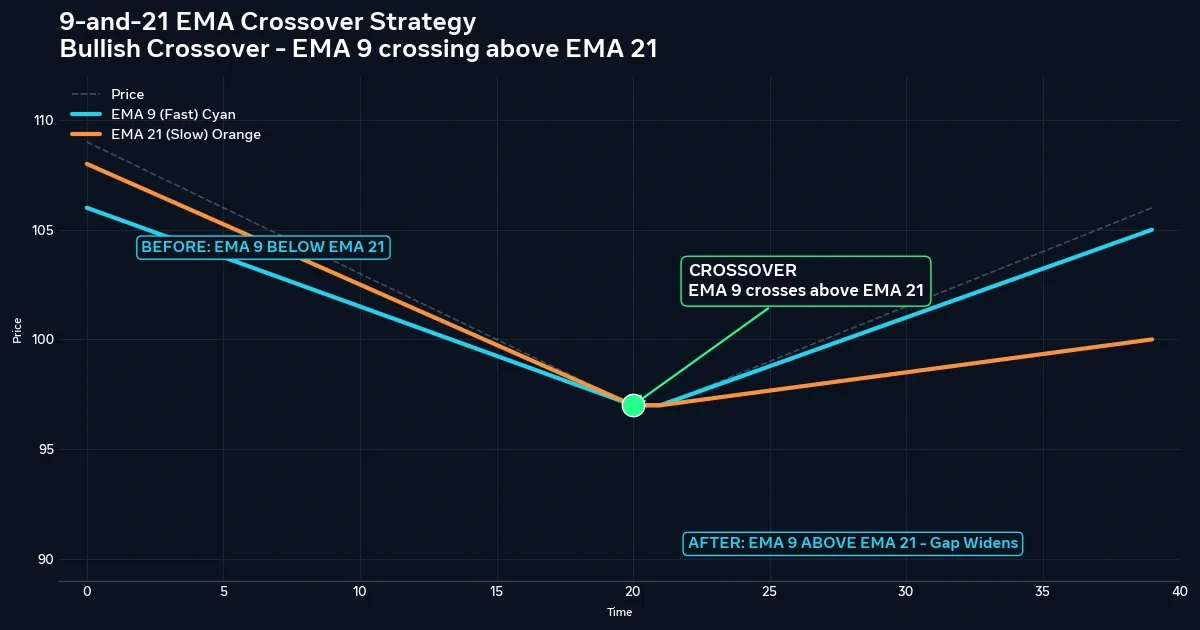
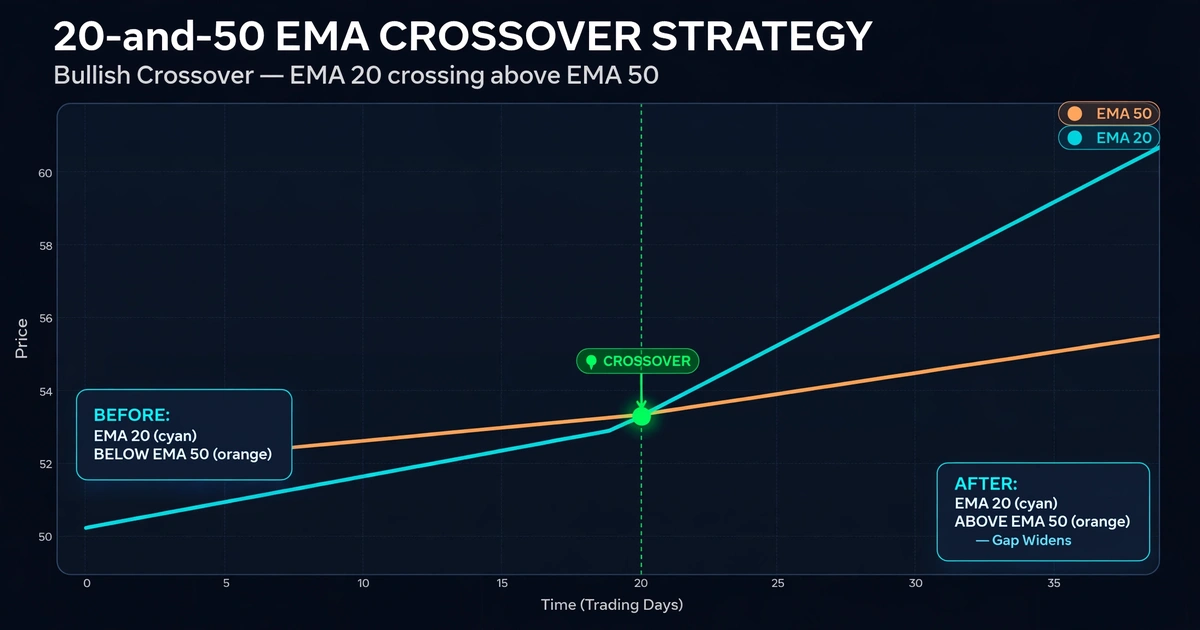
- A bullish cross is the 5 EMA closing above the 13 EMA. A bearish cross is the reverse.
- Many traders use the cross as a short-term momentum signal, place a tight stop beyond a recent swing point, and take a small target or exit on the opposite cross.
- The pair is fast, so it tends to give frequent signals, many of them false. It tends to suit active, trending periods and struggle in quiet or choppy ones. Nothing about it is guaranteed.
Why Five and Thirteen React So Quickly
An EMA blends the newest close into the previous EMA value using a smoothing factor:
EMA today = EMA yesterday + k × (Close today − EMA yesterday), where k = 2 ÷ (N + 1)
For the 5 EMA, k = 2 ÷ 6, about 0.333, so each new close carries roughly a third of the weight. For the 13 EMA, k = 2 ÷ 14, about 0.143, or around 14%.
A quick illustration: suppose the previous 5 EMA is 1.3600 and the next close is 1.3612. The new value is 1.3600 + 0.333 × 0.0012 = 1.3604. The line moved four pips on a twelve-pip jump, so it follows price closely but still smooths part of the move.
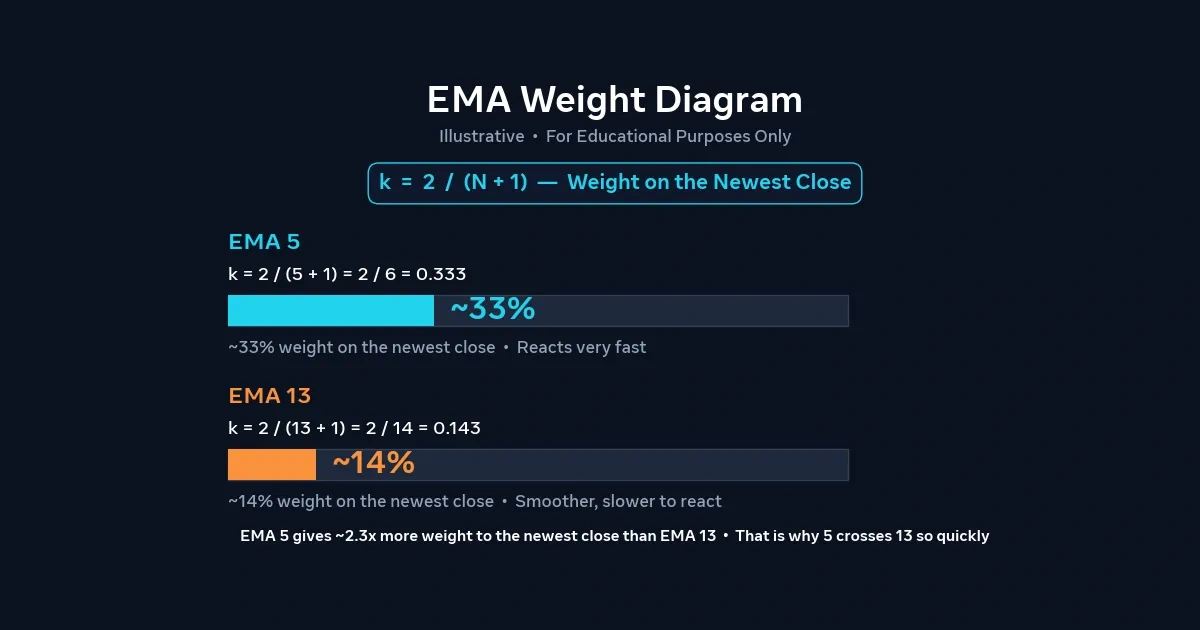
That responsiveness is the whole trade-off. A fast pair turns early, which means earlier signals, but it also flips on small, meaningless wiggles. If you want to see how a slightly slower pair compares, the 9 and 21 EMA crossover strategy covers it.
Five and Thirteen Candles Across Chart Sizes
The same two numbers describe very different stretches of time.
| Chart | 5 candles span | 13 candles span | Typical character |
|---|---|---|---|
| 1-minute | 5 minutes | 13 minutes | Extreme noise, spread dominates |
| 5-minute | 25 minutes | About 1.1 hours | Frequent crosses, tight stops needed |
| 15-minute | 1.25 hours | About 3.3 hours | Fewer signals, more room for a stop |
| 1-hour | 5 hours | 13 hours | Slow for this pair; signals are infrequent |
These spans are approximate because EMA weights aren’t equal. Shorter charts multiply the number of crosses and the cost of each one. Check the chart against the hours you can actually sit at a screen. A holding time measured in minutes needs you present, and the scalping vs day trading vs swing trading comparison shows how that choice shapes costs and stress.
Crossover Entries Built Around the 13 EMA
Treat the following as a rule set to test, not a recommendation.
Buy setup
- The 5 EMA closes above the 13 EMA after being below it.
- Wait for the candle to close. A cross visible mid-candle often disappears by the close.
- The 13 EMA should be sloping up or at least flat, not clearly falling.
- Enter at the next candle’s open, or wait for a small pullback toward the 5 EMA and accept that you may miss the move.
Sell setup
- The mirror image: the 5 closes below the 13 on a closed candle, with the 13 sloping down or flat.
Skip the signal if
- The two lines are tangled and have crossed several times in the last twenty candles.
- Price has already run a long way from the 13, which suggests the move is mostly done.
- A major news release is due within minutes, since spreads often widen and price can jump.
Tight Stops, Small Targets: Setting the Exit
Because the pair is fast, stops and targets are usually small, which makes precision matter.
Common stop placements:
- Beyond the last swing point. For a buy, just below the most recent minor swing low.
- Beyond the 13 EMA with a buffer. A close back through the 13 can signal that the move has failed, but a stop placed exactly on the line is easy to clip.
Common exits:
- A fixed reward-to-risk target, such as 1.5 times the stop distance.
- The opposite cross. This can let a good move run, but lag means it often returns a large share of open profit.
Use one exit rule per test. Mixing them makes it impossible to tell which rule produced the result. A hard stop-loss order limits the damage from a sudden move, though it cannot promise a fill at your price.
Filters That Keep the 5/13 Out of Dead Markets
A whipsaw is a cross that reverses soon after it appears and stops you out. A fast pair produces plenty of them, so filters matter more here than on slower pairs.
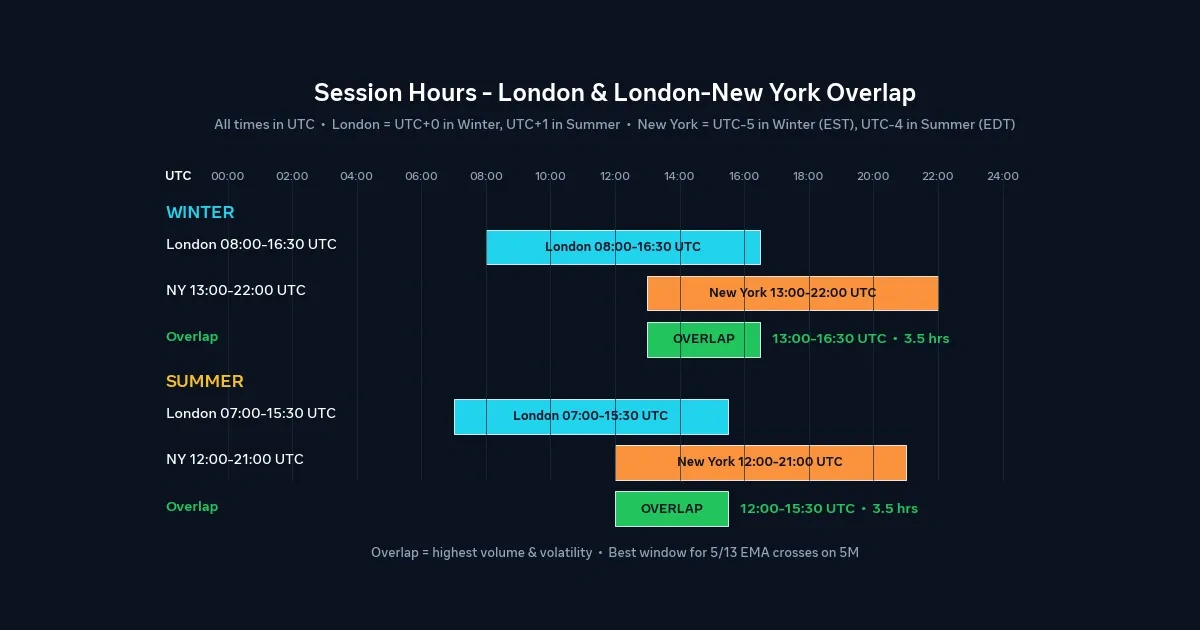
- Session timing. Fast crosses tend to behave better when the market is active. For many pairs, that means the London session and the London–New York overlap, roughly 13:00–17:00 UTC in northern-hemisphere winter and 12:00–16:00 UTC when both regions are on summer time. The US and UK change their clocks on different dates, so recheck the offset each spring and autumn. Forex trading sessions explained covers why activity varies by hour.
- Slope of the 13. A flat 13 EMA suggests no direction worth following.
- Gap between the lines. Some traders skip crosses where the lines barely separate afterward.
- Spread check. If the current spread is wider than usual, skip the setup, since cost share is the biggest threat to a fast system.
Every filter removes some good trades as well as bad ones. Keep a filter only if your journal shows it improved results after costs.
A Hypothetical USD/CAD Scalp, Line by Line
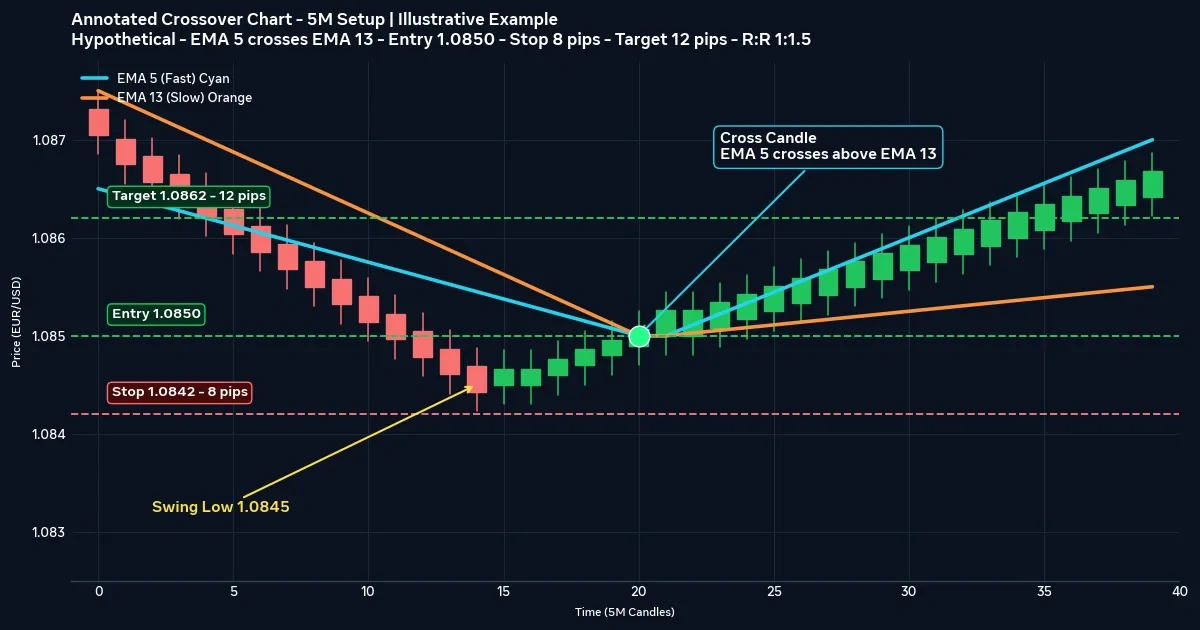
Assume a $2,000 account risking 1% ($20) per trade. On USD/CAD, one pip is 0.0001, so a standard lot (100,000 units) moves 10 Canadian dollars per pip. At an assumed rate of 1.3600, that is about $7.35 per pip per lot. The dollar value of a pip shifts as the exchange rate moves.
On a 5-minute chart during the London session, the 5 EMA closes above the 13 EMA, and the 13 is sloping up. A trader buys at 1.3600, places a stop at 1.3592 below the last minor swing low, and sets a target at 1.3612.
- Stop distance: 8 pips. Target distance: 12 pips. Reward-to-risk is 1.5:1.
- Position size: $20 ÷ (8 × $7.35) = 0.34 lots, where one pip is about $2.50.
- Spread of 1.0 pip costs about $2.50. No commission or swap is assumed.
- If the target is hit: 12 × $2.50 = $30.00, minus $2.50, leaves about $27.50.
- If the stop is hit: 8 × $2.50 = $20.00, plus $2.50, is a loss of about $22.50.
This is a hypothetical example for illustration only. Prices and costs are invented, real fills differ, and slippage or a spike could produce a larger loss than $22.50. Short-term moves of this size can also be swamped by a momentary spread widening.
Spread Math: How the 5/13 Cross Eats Its Own Edge
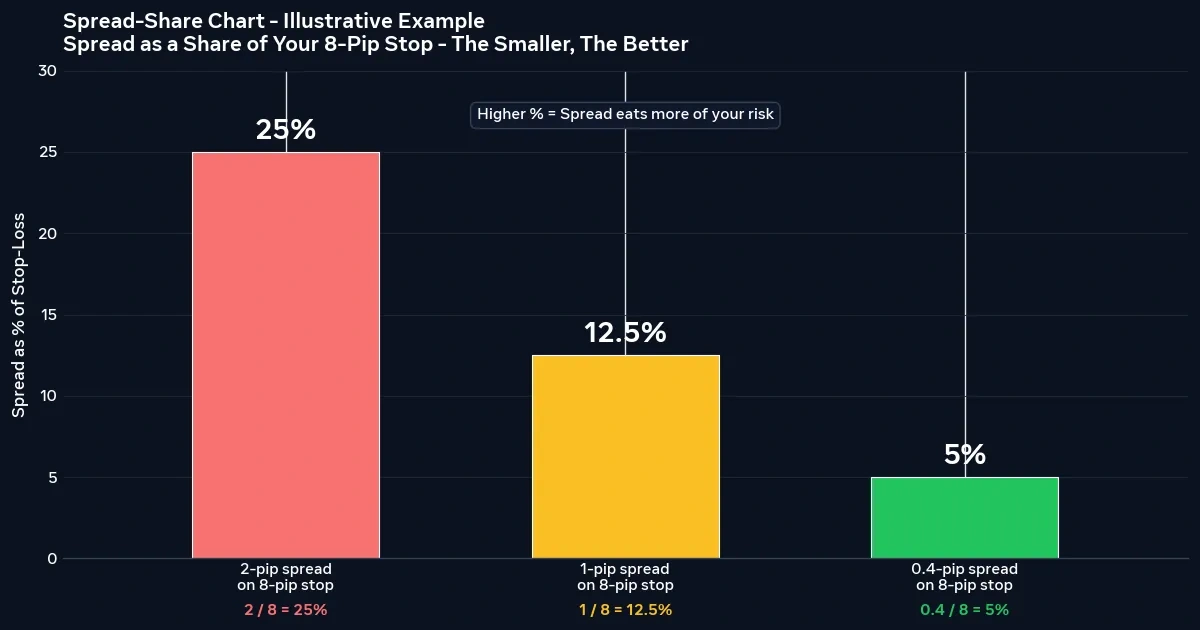
Take that 1.0-pip spread and compare it to different stop distances:
| Stop distance | Spread as share of stop |
|---|---|
| 4 pips | 25% |
| 8 pips | 12.5% |
| 20 pips | 5% |
The tighter the stop, the more of each trade is spent on cost before the market has moved. Now the break-even point, using the example above, where a win nets $27.50 and a loss costs $22.50:
$22.50 ÷ ($22.50 + $27.50) = 0.45, or 45%.
In this hypothetical setup, the system needs to win about 45% of its trades just to cover costs. That is a calculation, not a forecast. Nobody can say what win rate a fast crossover will produce in live markets, and it changes with conditions.
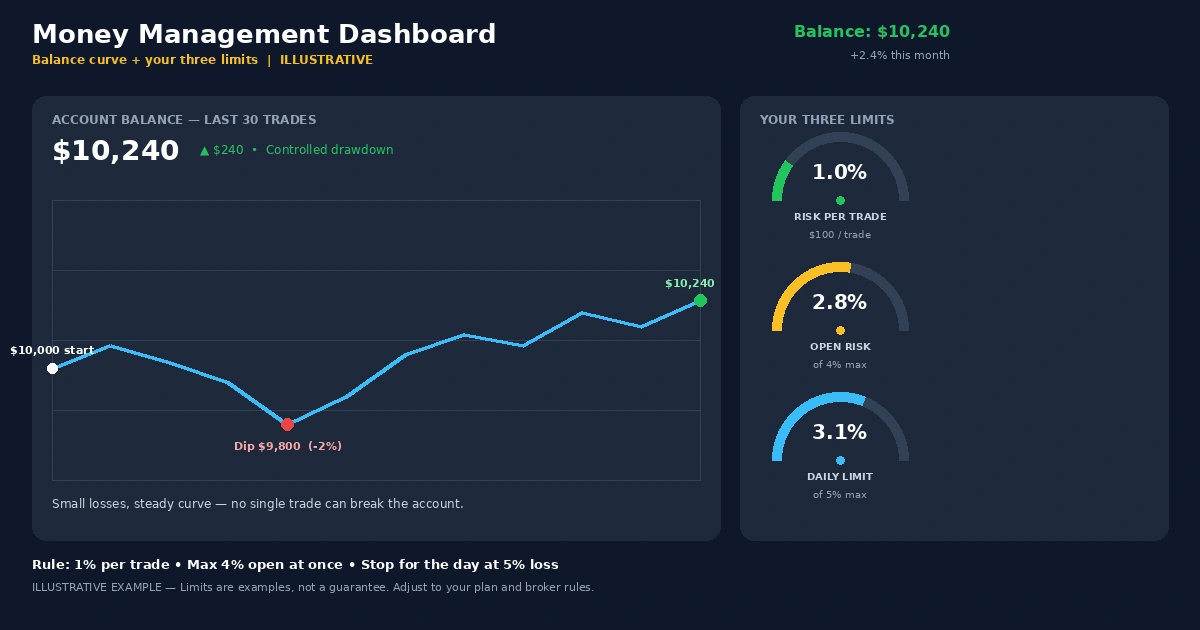
Then consider streaks. Eight consecutive losses at $22.50 total $180, which is 9% of the account. A fast pair can produce several losses in an hour, and a trader who isn’t prepared for that is likely to break the rules. If a run like that would push you to double your size, trade smaller.
Habits That Turn a Fast Cross Into a Fast Loss
- Entering before the candle closes. On fast charts, mid-candle crosses vanish constantly.
- Trading every cross. Most are noise. Without filters, a day of crosses can produce a string of spread-sized losses.
- Moving the stop to “give it room.” A stop widened after entry breaks the position size you calculated.
- Re-tuning the numbers. Switching from 5/13 to 4/11 to 6/15 after a bad session fits the past and says little about the future.
- Chasing after a missed cross. Entering well after the cross means your stop distance and risk math no longer match the plan.
- Trading through news. Spreads can widen sharply and fills can slip around major releases.
Who Should Leave the 5/13 Alone
Consider skipping this approach if you:
- can’t watch the chart continuously while a trade is open;
- have an unstable connection or a platform that lags;
- tend to trade emotionally after quick losses, a pattern covered in how emotions affect trading decisions;
- trade an account so small that spread eats most of every target;
- want a calm, low-frequency routine, since this pair demands many fast decisions.
Where Fast Crosses Lose Money: Spread, Chop, and Slippage
Spread and cost. The faster the style, the larger the share of each trade that goes to costs. A fraction of a pip of extra spread can change the math on an 8-pip stop.
Chop. In sideways conditions, the two lines cross repeatedly, and each failed trade costs the stop distance plus spread. The losses add up faster than most beginners expect.
Slippage and execution. Fast entries depend on getting filled near your price. Requotes, platform lag, and spikes around news can change the result of a trade measured in a handful of pips.
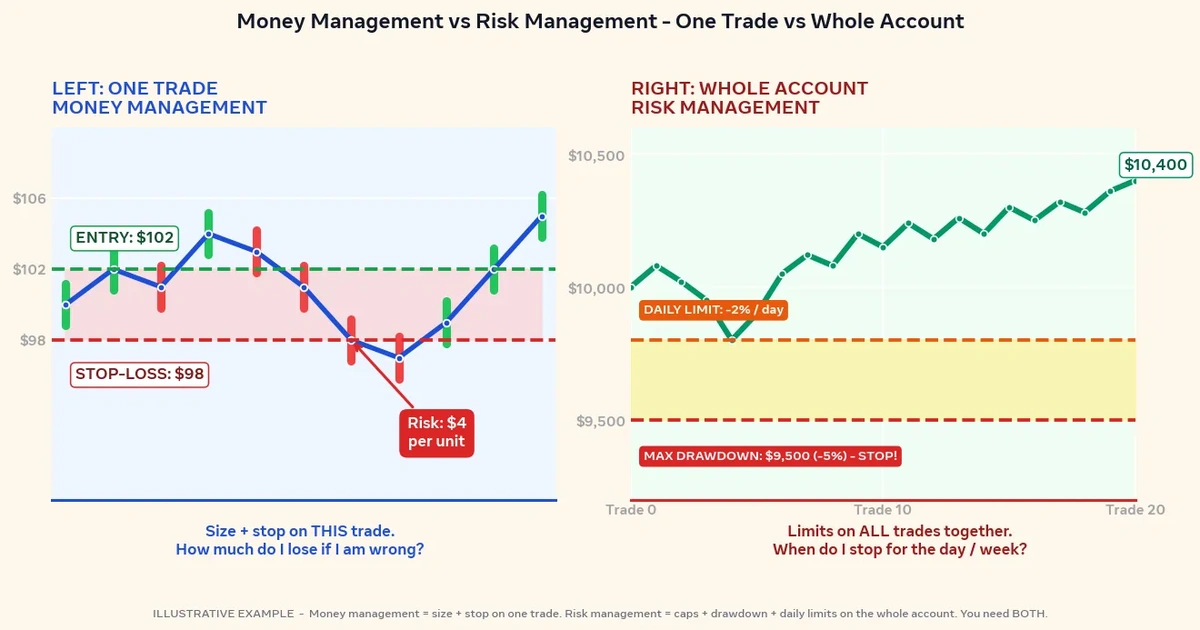
Leverage. Leverage magnifies losses as well as gains, and a trader can lose the full amount deposited. Sizing each trade as a small, fixed percentage of the account, as laid out in the forex risk management complete guide, keeps a bad run survivable.
Backtest versus live. A backtest can look strong when real spreads, slippage, and the pressure of an open trade are left out. Past results do not predict future ones.
Fast EMA Questions Traders Ask
Is the 5 and 13 EMA crossover good for scalping?
It is commonly used for short-term trading, but it isn’t a shortcut to profit. Its quick signals can help you find momentum, and they also produce many false crosses. Costs weigh heavily on small targets, so test it on a demo account with spread included before using real funds.
What timeframe works best for the 5/13 EMA cross?
No timeframe works best for everyone. The 1-minute and 5-minute charts give the most signals and the most noise. The 15-minute chart gives fewer, slightly cleaner crosses with room for a wider stop. Pick the chart that fits your free hours and test it.
How is the 5/13 different from the 9/21 EMA?
The 5/13 is faster, so it signals earlier and more often, with more false starts. The 9/21 smooths more but lags more. Neither is correct in the abstract. The choice depends on your timeframe, your costs, and how much noise you can tolerate.
Should I use a trend filter with it?
Many traders do, such as a higher-timeframe direction check or a slower average like the 50 EMA. A filter can remove weak signals, but it also removes some good ones. Add one at a time and check whether it improves results after costs. For a slower pair, see the 20 and 50 EMA crossover strategy.
Can I automate the 5/13 crossover?
It can be coded as an automated rule, but automation doesn’t remove the risks. Spread, slippage, and changing market conditions still apply, and a system tuned to past data may fail live. Test any automated version on a demo account first and understand how it works.
Speed Is a Cost You Pay Per Trade
The 5 and 13 EMA pair gives quick information, and quick information comes with quick mistakes. Each cross arrives with a spread to pay, a stop to size, and a decision to make before the move is over. The pair rewards a trader who filters hard, keeps costs low, and follows a written plan.
For your next step, open a 5-minute chart on a demo account and mark the next fifteen crosses during one London session, noting the spread at each. Count how many reached a 1.5:1 target before the stop. That tally will show you your own cost-adjusted picture.
Disclaimer
This article is for educational purposes only and is not financial advice. Forex and CFD trading involves a high level of risk, and you can lose some or all of your capital. Leverage can magnify both gains and losses. Never trade with money you can’t afford to lose.
This is a trading framework, not a guarantee. No strategy wins every trade, and results vary with market conditions, execution, and risk management.
Any percentages or figures shown are historical averages or hypothetical examples, not guarantees. Past performance does not predict future results.
Join now
Comments (0)
Be the first to comment.