
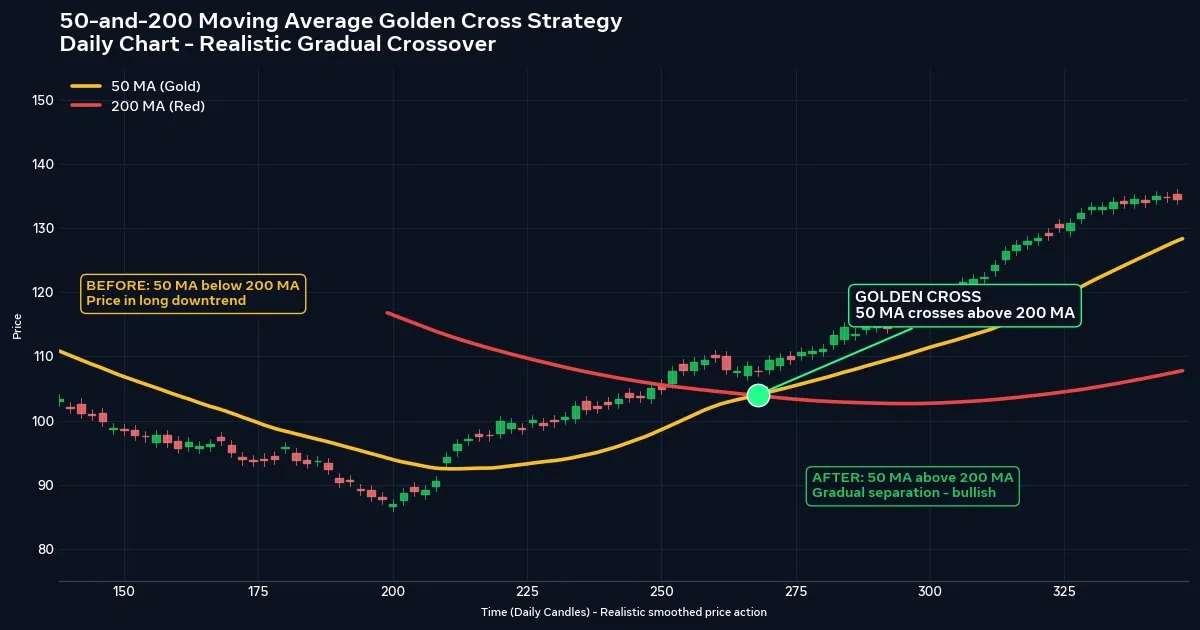
50 and 200 Moving Average Golden Cross Trading Strategy
Financial headlines love the phrase “golden cross,” and the name makes it sound like a verdict. It is a much plainer event: the 50-period average rising above the 200-period average. The 50 and 200 moving average golden cross strategy turns that event into a rule for joining a long-term uptrend, and it runs on a clock measured in weeks and months, not minutes. Below you’ll find what the cross measures, how late it arrives, a priced hypothetical trade with swap included, and the long dry spells and false signals that come with it.
One Cross, Two Names, Three Facts to Know First
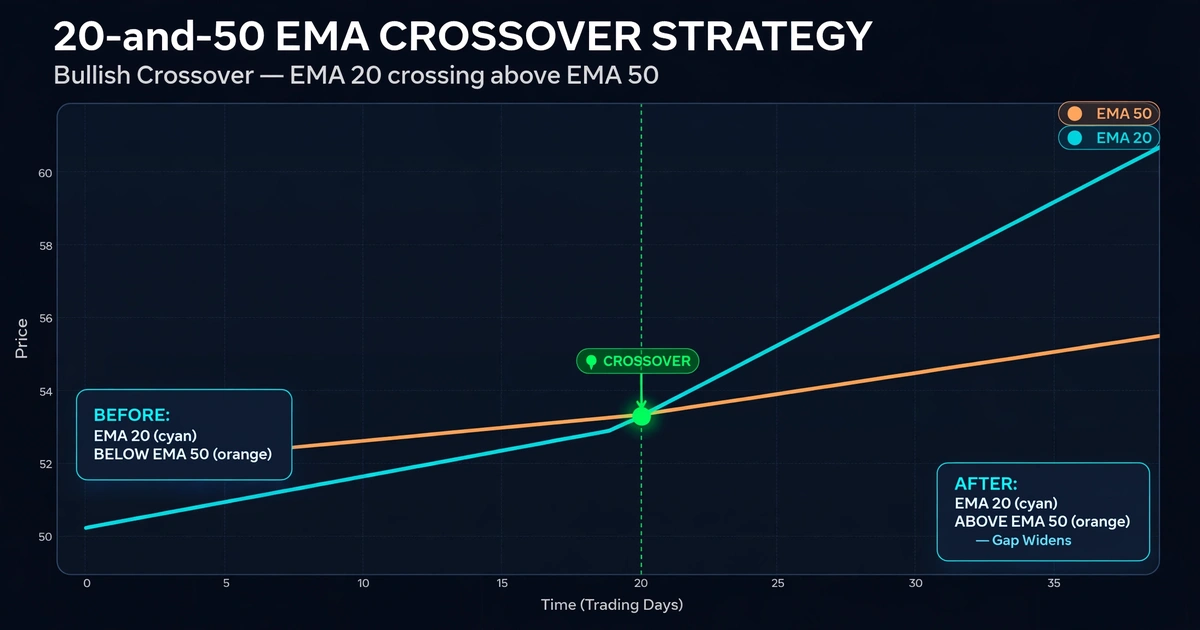
- A golden cross is the 50-period moving average closing above the 200-period average. A death cross is the reverse.
- It is a slow, late confirmation of a trend that is already underway, usually read on daily or weekly charts. It is not a turning-point detector.
- It signals rarely, uses very wide stops, and can fail in sideways markets. Some years may produce no clean signal on a given pair, and none of its signals is guaranteed to work.
Why 200 Days Is a Long Memory
A simple moving average (SMA) adds the last N closing prices and divides by N. On a daily chart, the 50 SMA covers about ten trading weeks, and the 200 SMA covers about forty. The 50 follows the medium-term drift, while the 200 describes something closer to the market’s long-run direction.
For the fast line to climb above the slow one, recent prices must have stayed above the long-term average for a while. That is why the cross is slow. An equal-weighted average of N closes reflects price from about (N − 1) ÷ 2 candles ago, which is 24.5 candles for the 50 and 99.5 candles for the 200. On a daily chart, that is roughly five weeks and twenty weeks of delay respectively.
That lag is the price of filtering out noise. If you want a faster version of the same idea, the 10 and 50 moving average crossover strategy shows what you gain and lose by shortening the memory.
Half the Move Is Gone: A Hypothetical Lag Count
Picture a pair that climbs from 0.8000 to 0.9200 over about a year, a 1,200-pip advance. The 50 SMA crosses above the 200 SMA when price is near 0.8600. By then, price has already covered 600 pips, which is half the entire move.
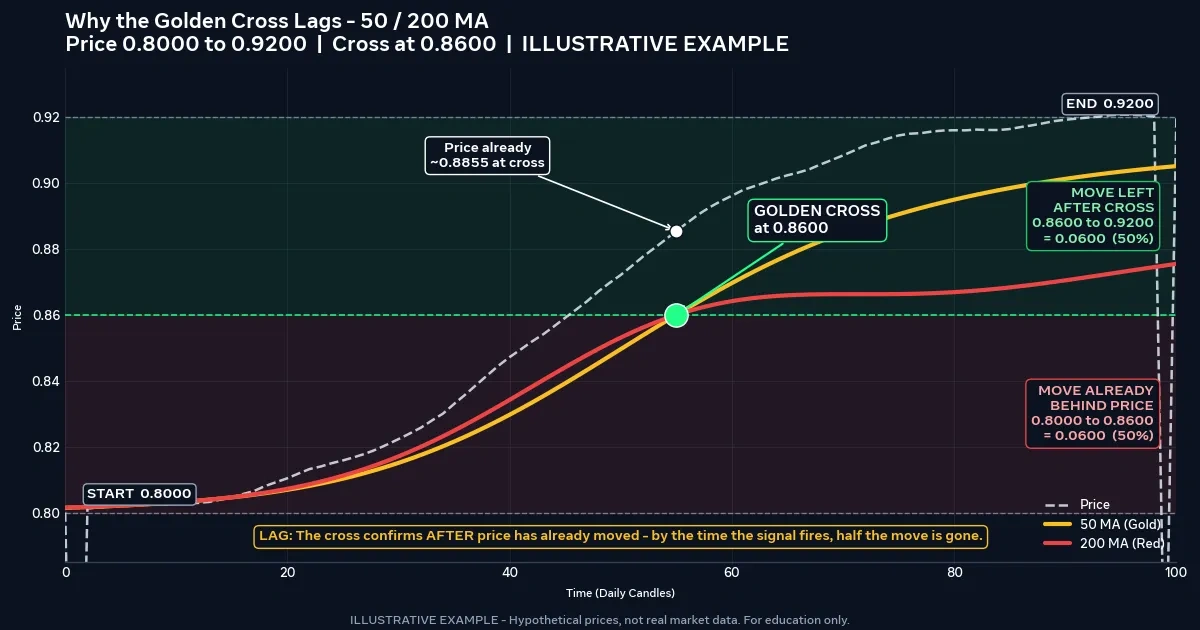
A trader who waits for the cross is not buying the start of the trend. She is buying the part that remains, and only if the trend continues. If the advance stalls at 0.8700, the cross would have delivered a buy near the top of the range.
This is a hypothetical example for illustration only. Real trends vary in length, and many never reach the extent shown. The takeaway is that a golden cross trades certainty for lateness, so the stop and the position size have to be built around that fact.
SMA or EMA for a Slow Pair
Most golden cross discussions assume simple averages, because the 50/200 convention grew up around the SMA on daily charts. An exponential average gives more weight to recent closes and turns sooner, which would bring the cross forward by some days but add more false signals.
Neither is correct in the abstract. For this article, assume simple averages calculated on closing prices. Whichever you pick, fix the choice before you test, because swapping types mid-trial makes your results impossible to compare.
Reading the Golden Cross on Daily and Weekly Charts
The same two numbers describe very different stretches of time depending on the chart.
| Chart | 50 candles span | 200 candles span | Typical character |
|---|---|---|---|
| 4-hour | About 1.7 weeks | About 6.7 weeks | Frequent crosses, more noise, and less of the “long-term” meaning |
| Daily | About 10 weeks | About 40 weeks | The conventional chart, with signals that are rare and slow |
| Weekly | About 1 year | Nearly 4 years | Very rare signals, huge stops, and swap matters a great deal |
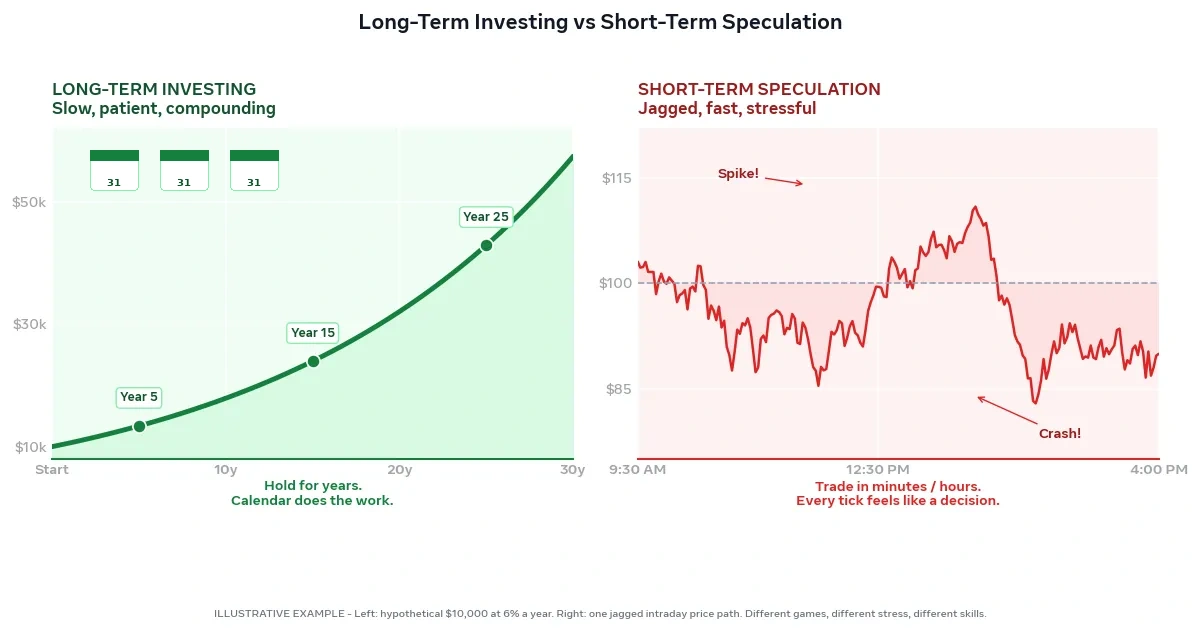
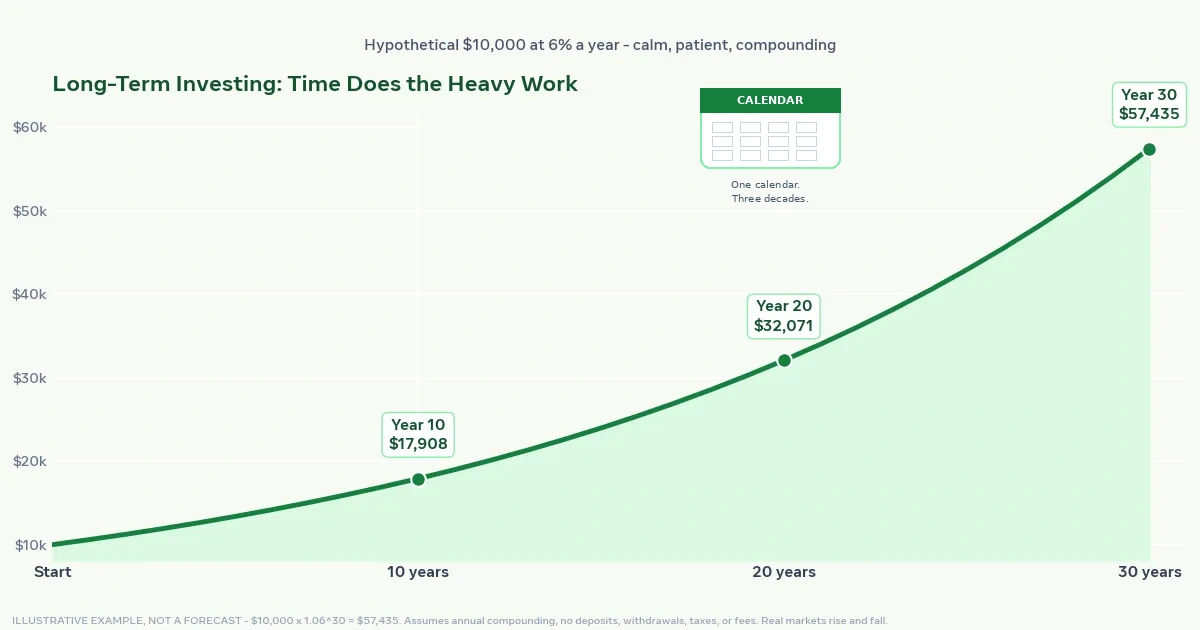
The weekly chart gives the most meaningful trend reading but demands the most capital and patience. The 4-hour chart gives more crosses, but the 50 and 200 are no longer long-term anchors there. Some stock and index investors watch this cross too, but a leveraged margin position is a different instrument from a long-term holding, and long-term investing vs short-term speculation explains why the risk profile changes.
Rules for Taking, Skipping, and Sizing a Golden Cross Signal
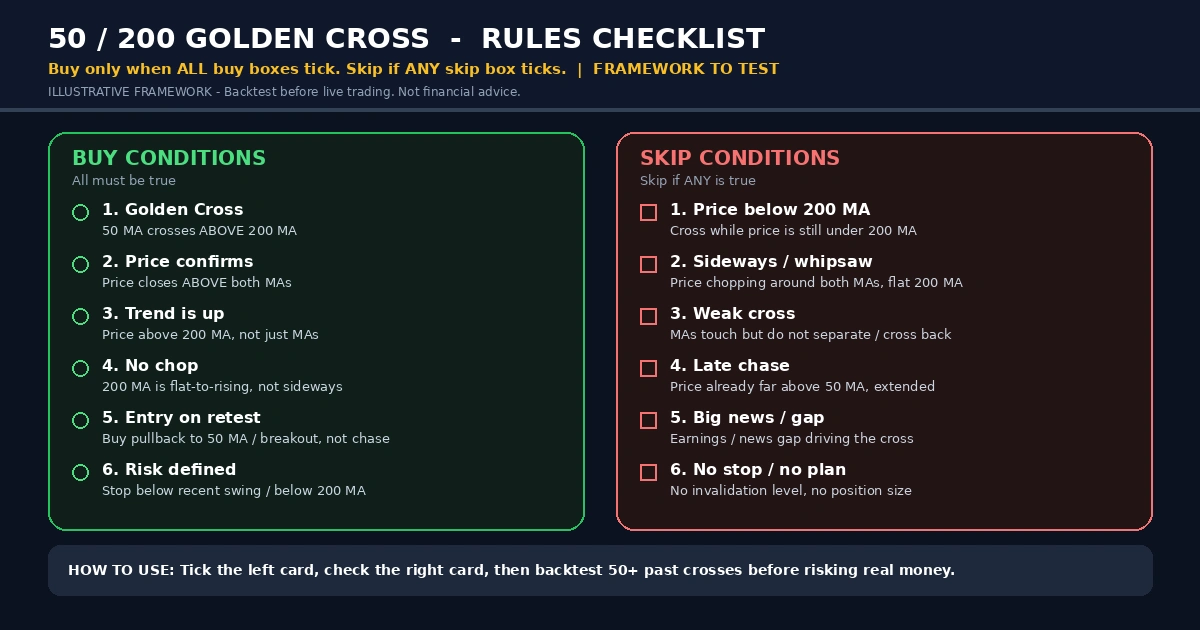
Treat this as a rule set to test, not a recommendation.
Buy setup
- The 50 SMA closes above the 200 SMA after being below it, confirmed on a closed daily candle.
- The 200 SMA is flat or rising. A falling 200 with a bullish cross suggests a short rebound inside a larger downtrend.
- Price is above both lines when you enter.
- Enter at the next candle’s open, or wait for a pullback toward the 50 and accept that you may miss the move.
Skip the signal if
- The two lines are bunched together and have crossed back and forth several times in the last year.
- Price has already run far above the 200, which suggests the cross is late even by this system’s standards.
- Your stop would need to be so wide that the position size drops below what your broker allows.
This is the trend-following logic described in trend following strategy for beginners. You join a move in progress and accept that you will miss the start of it.
Buying the Cross Versus Buying the First Pullback
After a golden cross, price often drifts back toward the 50 SMA, since the cross itself tends to follow a strong run. Some traders enter at the cross. Others wait for that first pullback and enter when price holds near the 50.
The pullback entry gives a closer stop and a better price, but the pullback may never come, and a close well below the 200 shortly after the cross suggests the signal has failed. The cross entry is simpler but sits further from any logical stop. Test one approach at a time so you can see which rule produces the results.
Stops Wide Enough to Survive Daily Noise
A trade that may last weeks needs a stop that ordinary daily swings won’t reach. Two common placements:
- Beyond the last major swing low. For a buy, below the low that preceded the cross. This ties the stop to structure but can be very far away.
- A multiple of volatility. For example, a multiple of the daily average true range (ATR, the typical candle range over a period), which adjusts to current conditions.
Common exits:
- A fixed reward-to-risk target, such as twice the stop distance.
- The opposite cross (the death cross). It lets a long trend run, but because of the slow lag, the exit often arrives after a large share of open profit has gone.
Use one exit method per test. A hard stop-loss order limits the damage from a sudden move, though it cannot promise a fill at your price.
A Hypothetical EUR/GBP Daily Long With Swap Included
Assume a $10,000 account risking 0.75% ($75) per trade. On EUR/GBP, one pip is 0.0001, so a standard lot moves 10 British pounds per pip. At an assumed GBP/USD rate of 1.2500, that is about $12.50 per pip per lot. The dollar value of a pip shifts as exchange rates move.
On the daily chart, the 50 SMA closes above the 200 SMA, both sloping up, with price above both. A trader buys at 0.8600, places a stop at 0.8450 below the last major swing low, and sets a target at 0.8900.
- Stop distance: 150 pips. Target distance: 300 pips. Reward-to-risk is 2:1.
- Position size: $75 ÷ (150 × $12.50) = 0.04 lots, where one pip is about $0.50.
- Spread of 1.5 pips costs about $0.75.
- Assume a hypothetical swap charge of $0.08 per night.
- If the target is hit after 60 nights: 300 × $0.50 = $150.00, minus $0.75 spread and $4.80 swap, leaves $144.45.
- If the stop is hit after 20 nights: 150 × $0.50 = $75.00, plus $0.75 spread and $1.60 swap, is a loss of $77.35.
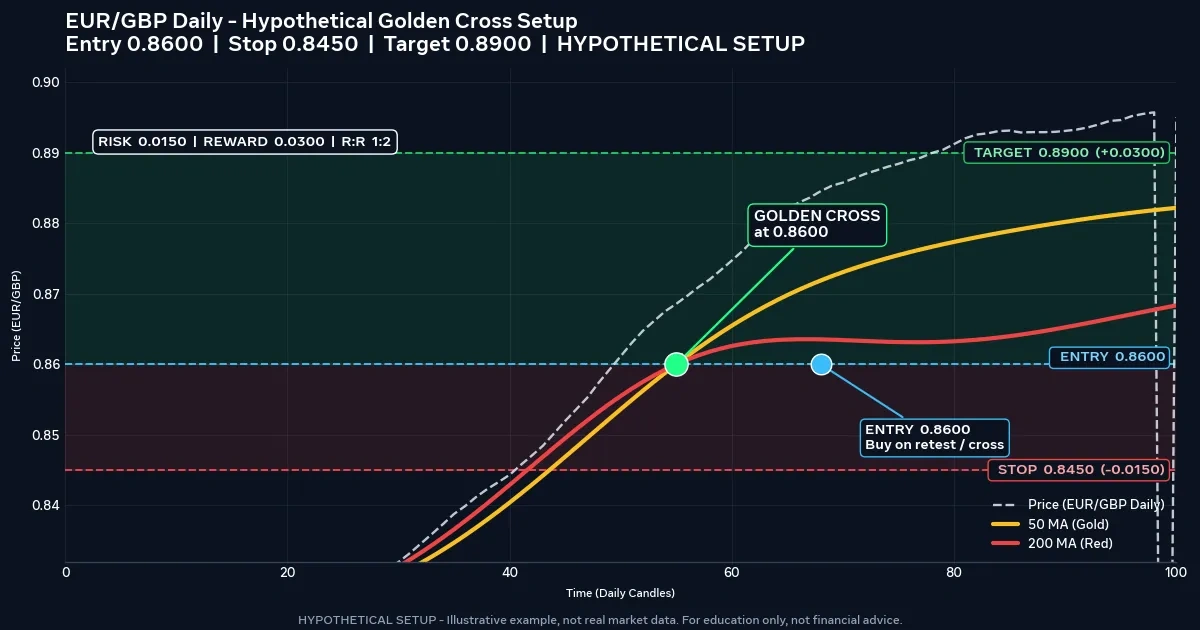
This is a hypothetical example for illustration only. Prices, swap, and holding times are invented, real fills differ, and a gap past the stop would produce a larger loss than $77.35. Some brokers set minimum lot sizes that a 150-pip stop could push you below on a small account.
The Break-Even Count for a Slow Trade
Using the numbers above, a win nets $144.45 and a loss costs $77.35. The break-even win rate is the loss divided by the sum of loss and win:
$77.35 ÷ ($77.35 + $144.45) = 0.349, or about 34.9%.
In this hypothetical setup, roughly one trade in three would have to win just to cover costs. That is arithmetic, not a forecast. Nobody can say what win rate a golden cross system will produce in live markets.
Streaks matter just as much. Five consecutive losses at $77.35 total $386.75, about 3.9% of the account. Because signals are rare, that streak could stretch across years of calendar time, and few traders keep following rules through that without wavering.
Death Cross Mirror Trades and the Swap Question
The sell version works the same way in reverse: the 50 closes below the 200, the 200 is flat or falling, and price sits below both lines. The stop goes above the last major swing high.
The main difference is swap. Depending on the pair, the direction, and the provider, holding a short position can cost or earn a financing charge each night, and over many weeks it can become a meaningful part of the trade. Check the swap for your direction before you commit, because it varies by provider and can change.
False Golden Crosses in Sideways Years
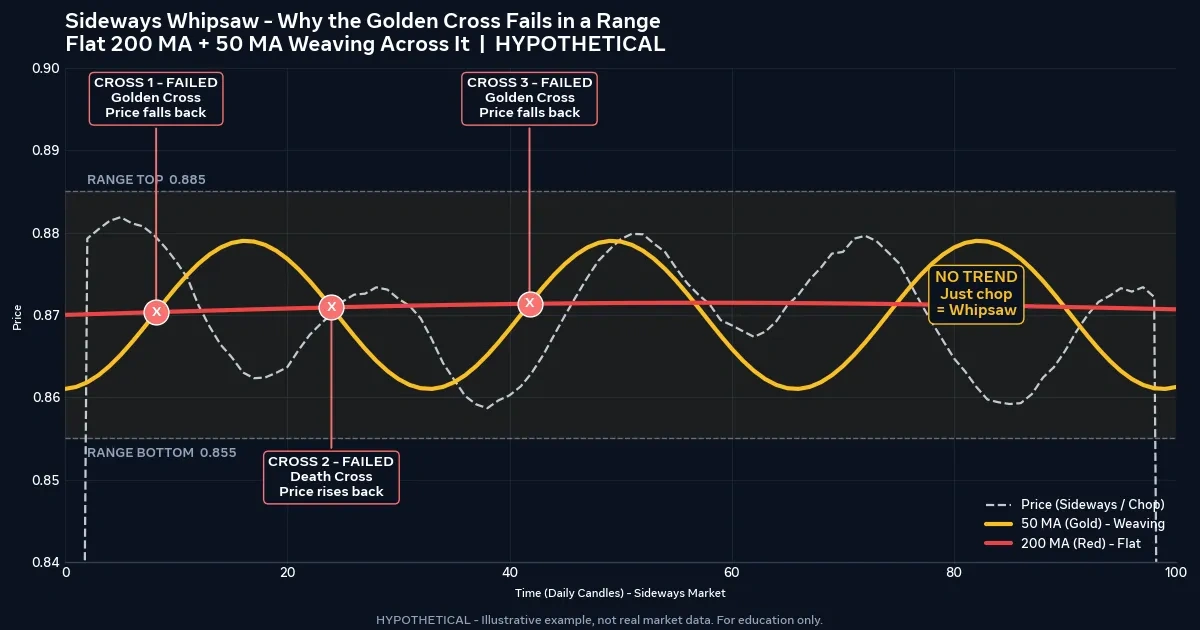
A slow system is not immune to whipsaws. When price drifts sideways for a year or more, the 50 can weave back and forth across a flat 200, producing a golden cross, a death cross, and another golden cross in succession. Each false signal costs a very wide stop, and a few of them in a row can be painful.
Take the hypothetical trade above. Three failed crosses at $77.35 each cost $232.05, about 2.3% of the account, and the winners that eventually follow must cover that. Because each trade ties up capital for weeks, the drag is slow rather than sudden, which can make it harder to notice and harder to stomach. Sideways conditions are better handled by methods designed for them, such as range trading explained.
This is a hypothetical example for illustration only, and the number of failed crosses is invented to show sensitivity, not typical results.
Habits That Spoil a Slow Signal
- Entering before the daily candle closes. A cross visible during the day can disappear by the close.
- Shrinking the stop to fit a lot size you want. A stop moved tighter than structure justifies is just a faster loss.
- Swapping 50/200 for 40/180 after a bad year. Retuning to the past says little about the future.
- Ignoring swap on long holds. Weeks of financing charges can turn a marginal trade into a loser.
- Treating the cross as a forecast. It describes what price has already done.
- Skipping the 200’s direction. A bullish cross under a falling 200 deserves more doubt, not less.
Who Will Lose Patience With a 50/200 System
Consider skipping this approach, or adjusting expectations, if you:
- want frequent trades and quick feedback;
- can’t tolerate a wide stop that may take weeks to resolve;
- trade a small account where a 150-pip stop forces a position below your broker’s minimum;
- expect to catch trend beginnings rather than confirmations;
- tend to abandon rules after a few losses in a row.
What Can Go Wrong When a Golden Cross Fails
Lag. By the time the cross appears, much of the move may be over, and the opposite-cross exit can hand back a large share of open profit.
False signals. In sideways conditions the lines cross repeatedly. Each failed trade costs a wide stop, and recovery depends on a few large winners that may not arrive.
Gaps and slippage. Price can jump past your stop around news or over a weekend. A stop-loss limits loss only when the market fills it near your price.
Swap and tied-up capital. Holding for weeks or months means financing charges accumulate and margin stays locked while the trade works out.
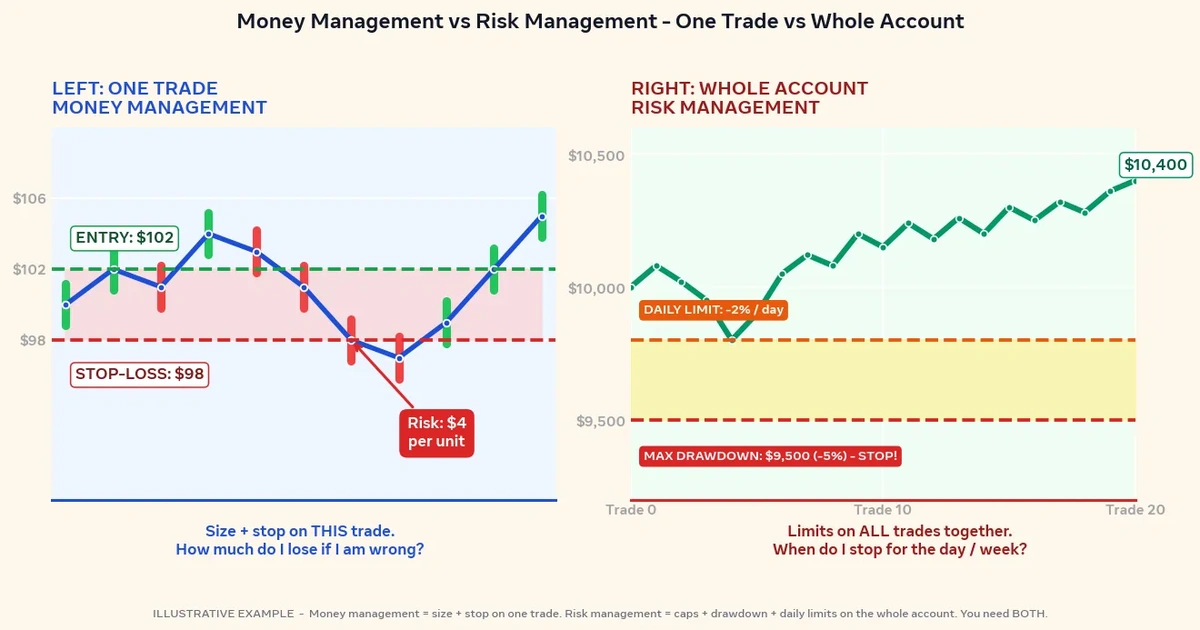
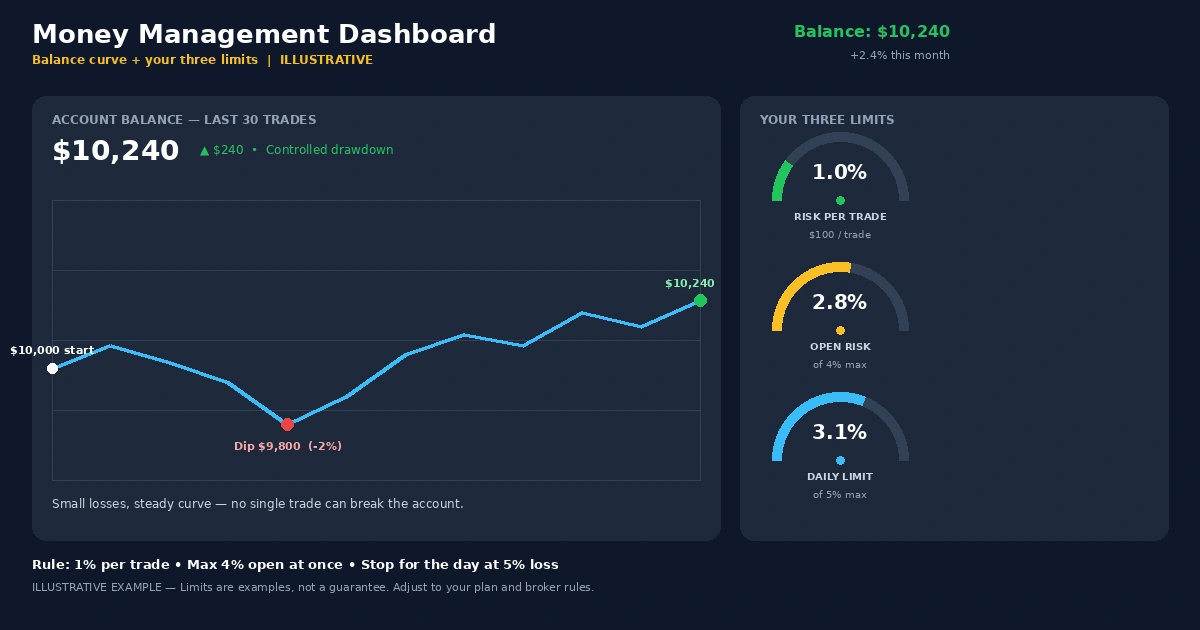
Leverage. Leverage magnifies losses as well as gains, and a trader can lose the entire deposit. Risking a small, fixed percentage per trade, as laid out in the forex risk management complete guide, keeps one bad run survivable.
Backtest versus live. A backtest can look clean when swap, spread, slippage, and the stress of waiting through a deep drawdown are left out. A slow system also produces few trades, so a sample can be too small to prove anything.
Golden Cross Questions Traders Raise
Is the golden cross a reliable buy signal?
No signal is reliable in every market. The golden cross tends to do better in sustained trends and worse in ranges, and it arrives late either way. Treat it as one piece of evidence, combine it with risk control, and test it on a demo account before using real funds.
Which timeframe is best for the 50/200 cross?
The daily chart is the convention, and the weekly chart gives the slowest, most trend-focused view. Shorter charts produce more crosses but lose the long-term meaning. Pick the timeframe that matches your patience and capital, then test it.
What is the difference between a golden cross and a death cross?
A golden cross is the 50-period average rising above the 200-period average, often read as a shift toward an uptrend. A death cross is the opposite, with the 50 falling below the 200. Both are lagging signals and can fail.
Does the golden cross work in forex as well as stocks?
The mechanics are identical, but forex adds leverage, swap, and 24-hour trading, while stocks and indices have different gaps and costs. Test it separately in the market you trade before assuming results carry over.
Should I use EMAs instead of SMAs?
Either can be used. EMAs turn sooner and produce more false signals, while SMAs are smoother and slower. Pick one, keep it fixed during testing, and compare results with costs included.
A Slow Signal Is a Filter, Not a Trigger
The golden cross works best as a statement about the broader backdrop: price has spent a long stretch above its long-term average. It does not time entries, and it carries wide stops, long holds, and months of silence. Its value is as a filter that keeps you from fighting a trend that has already shown itself.
For your next step, write down the lot size a 150-pip stop would give on your own account at a 0.75% risk. If the answer falls below your broker’s minimum, the system does not fit your account yet, and that is worth knowing before any chart work.
Disclaimer
This article is for educational purposes only and is not financial advice. Forex and CFD trading involves a high level of risk, and you can lose some or all of your capital. Leverage can magnify both gains and losses. Never trade with money you can’t afford to lose.
This is a trading framework, not a guarantee. No strategy wins every trade, and results vary with market conditions, execution, and risk management.
Any percentages or figures shown are historical averages or hypothetical examples, not guarantees. Past performance does not predict future results.
Join now
Comments (0)
Be the first to comment.