
Trend Trading Explained: Why “The Trend Is Your Friend” Works (and When It Doesn’t)
Anyone can spot a trend on a finished chart. Trading one while it’s still unfolding is harder, because pullbacks look like reversals and reversals look like pullbacks. Trend trading is the practice of identifying a market’s prevailing direction and taking trades that go with it instead of against it. “The trend is your friend” is the slogan, and there’s some logic behind it. There are also limits the slogan leaves out. This guide covers how traders define a trend, enter and exit one, and recognize when it has stopped paying.
Direction First, Entry Second, Exit Before Both
- Direction: Decide whether the market is trending up, down, or sideways, using structure (swing highs and lows) on a higher timeframe.
- Entry: Join the trend on a pullback, a breakout, or a moving average signal, and only in the direction you identified.
- Exit: Set your stop-loss before you enter, and decide in advance how you’ll take profit or trail the stop.
- Reality check: Trend trades often lose several times in a row before one large winner arrives. Trend trading is a framework to test, not a guarantee.
Why the Slogan Has Some Logic, and Why It Isn’t a Law
Trends exist partly because markets absorb information and large orders over time rather than all at once. Several forces are commonly cited:
- A central bank policy cycle can take months to play out.
- Large institutions often build or reduce positions gradually, to avoid moving the price against themselves.
- Traders pile in as momentum becomes visible, which can extend the move.
- Interest rate differences between two countries can keep demand for one currency elevated for long stretches.
None of these is guaranteed to last. A rate cycle can pivot on a single speech, a position can be unwound in a day, and the crowd that joined late can become the fuel for a reversal.
A better reading of the slogan is as a statement about odds. In a clear trend, trades in its direction have had the wind at their back, while trades against it have had to fight momentum. That doesn’t mean trends continue, only that you’re not swimming upstream while one lasts. Markets also alternate between trending and ranging phases, and many traders find sideways stretches more common than clean trends, though no ratio holds across pairs and years.
Defining a Trend Before You Trade It
Structure: The Swing Test
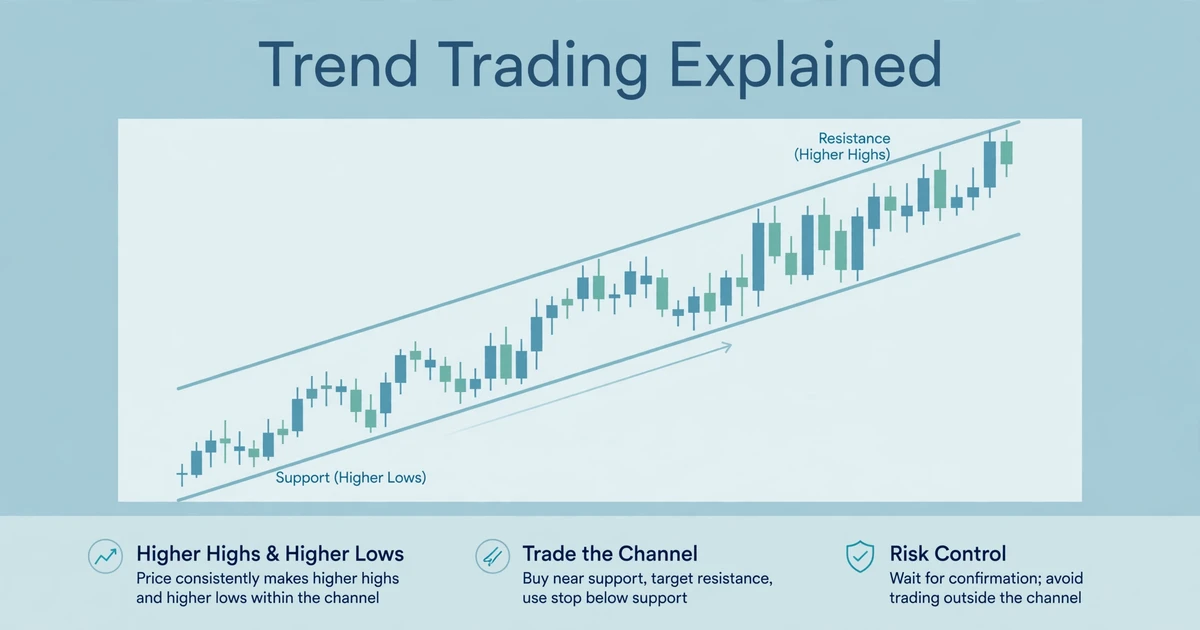
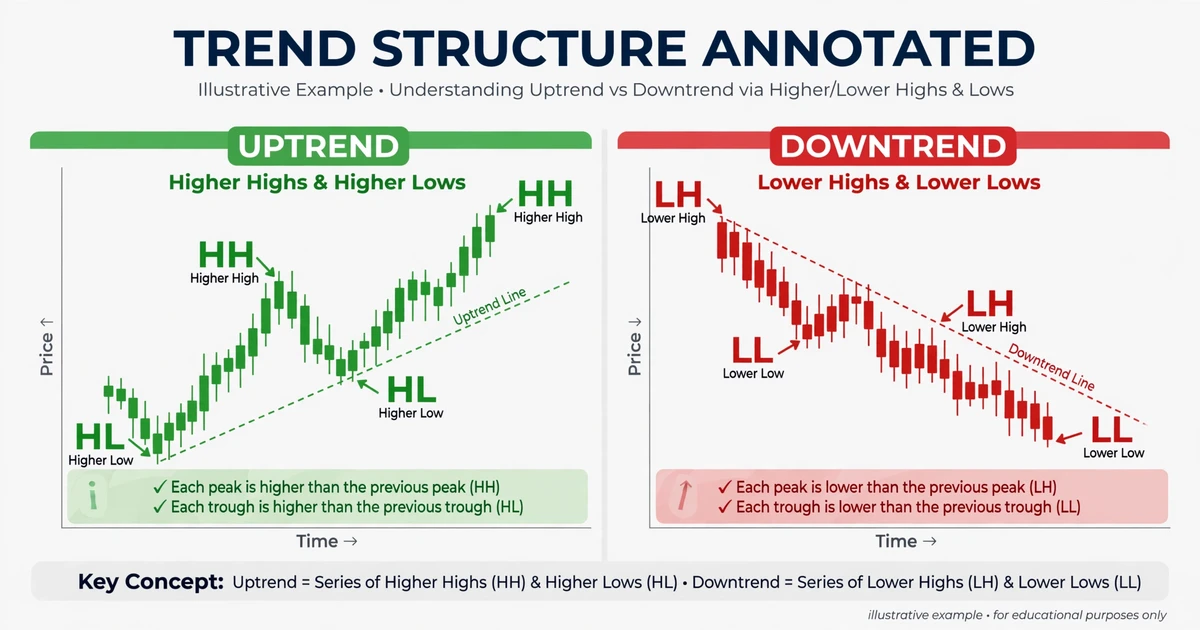
The most common definition uses swing points. An uptrend is a sequence of higher highs and higher lows. A downtrend is a sequence of lower highs and lower lows. When a market stops making either, the trend is paused or over. This is the definition most other tools approximate.
Line and Average: Two Visual Aids
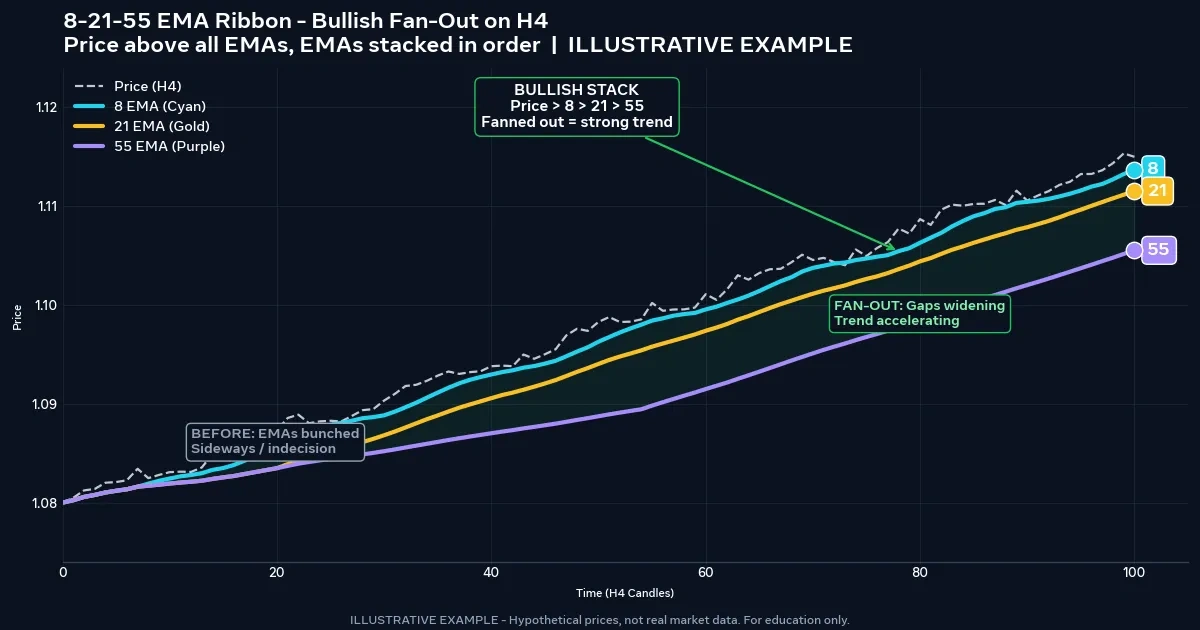
A trendline connects the swing lows of an uptrend or the swing highs of a downtrend, and it shows how steeply price is moving. Drawing one consistently takes a few rules, which we cover in how to draw trendlines correctly. A moving average gives a similar read by smoothing price: a rising average with price above it suggests an uptrend, and a falling average with price below it suggests a downtrend.
Timeframe Changes the Answer
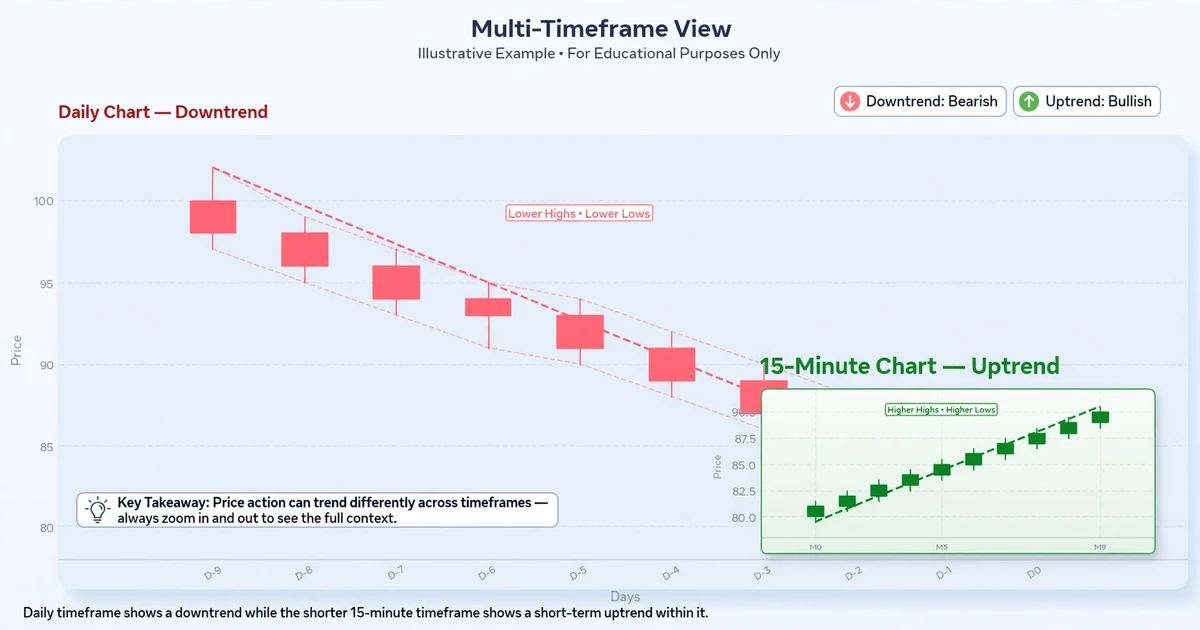
A trend always belongs to a timeframe. The same pair can be in a downtrend on the daily chart and an uptrend on the 15-minute chart. Many trend traders handle this by choosing direction on a higher timeframe and then looking for entries on a lower one, so they’re not buying a small bounce inside a larger decline.
Measuring Strength Without Overcomplicating It
Direction tells you which side to favor. Strength tells you whether the trend is worth trading at all. A few simple clues:
- Swing size and overlap. In a strong trend, pullbacks are shallow and candles move in one direction with little overlap. In a weak one, candles overlap and swings are choppy.
- Average slope. A moving average that’s clearly tilted suggests momentum. A flat one suggests there isn’t any.
- Average Directional Index (ADX). This indicator, usually set to 14 periods, measures trend strength without regard to direction. Readings above roughly 25 are commonly read as trending and readings below roughly 20 as weak or absent, though those cutoffs are conventions, not rules.
Pick one or two of these and apply them consistently. Adding a dozen only lets you find a reason to take any trade.
Three Ways Into a Trend: Pullback, Breakout, and Crossover
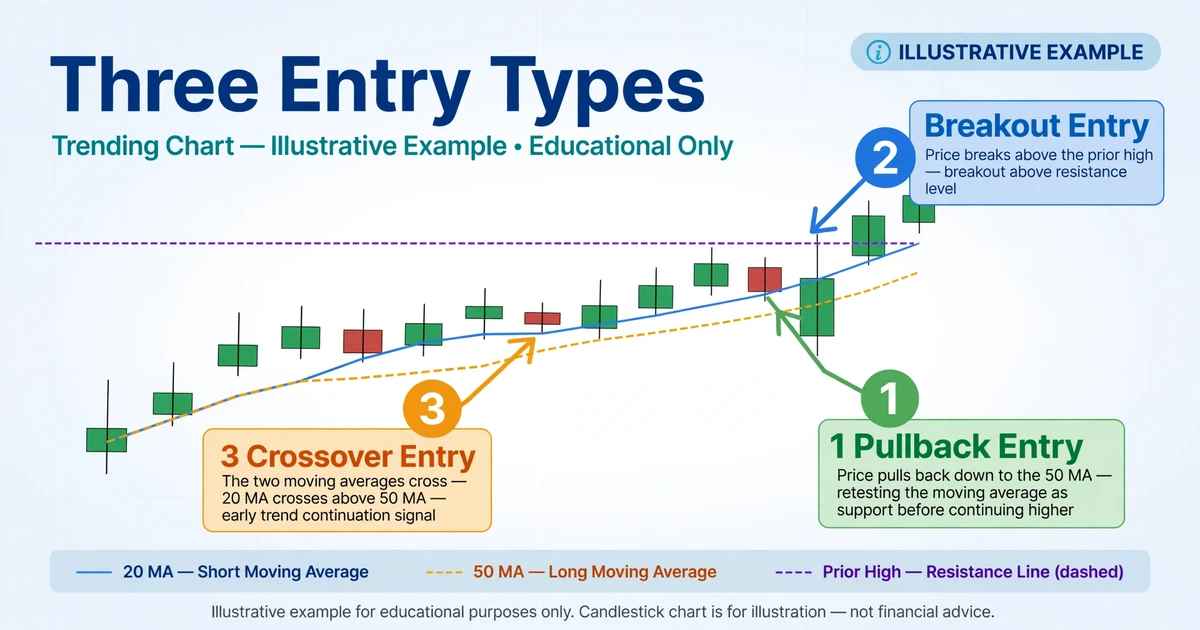
| Entry type | The idea | Where the stop usually goes | Main weakness |
|---|---|---|---|
| Pullback | Wait for a retracement, then enter as price resumes | Beyond the pullback’s extreme | The pullback may not stop where you expect, or may turn into a reversal |
| Breakout | Enter when price clears a prior high or consolidation | Back inside the broken range | False breakouts, and entries that arrive late and extended |
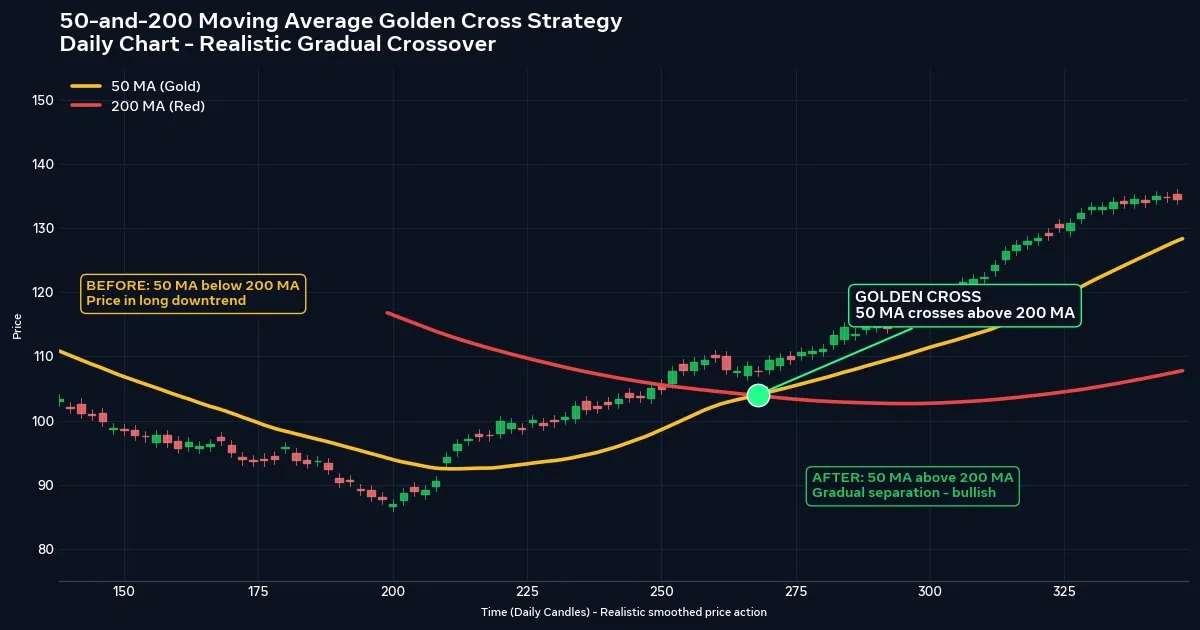
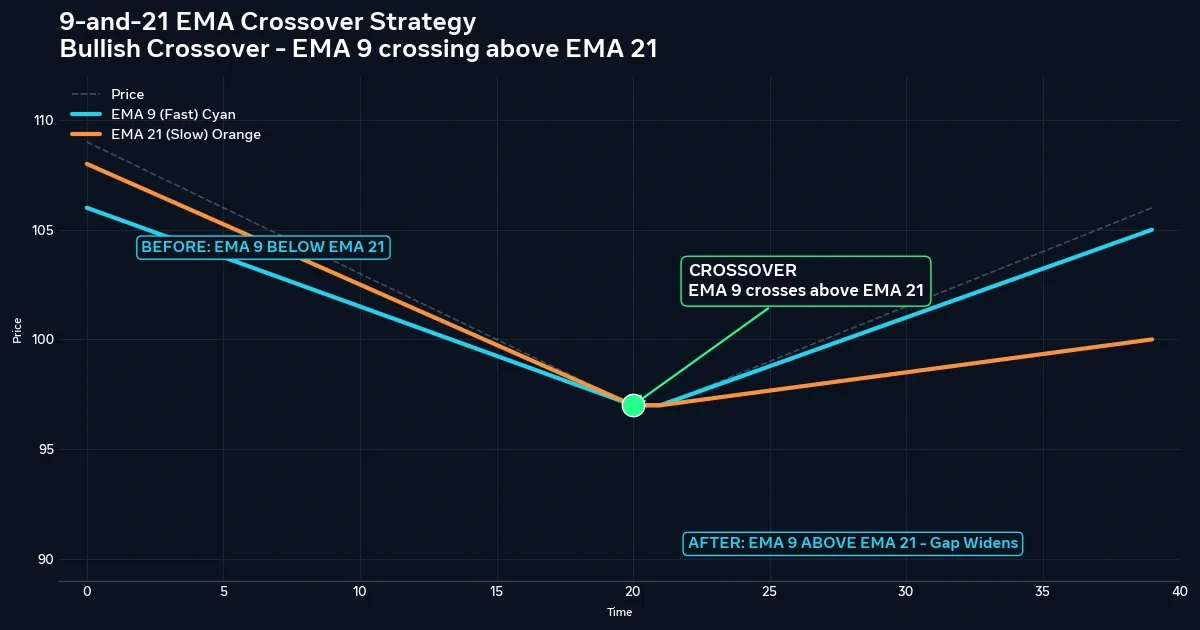
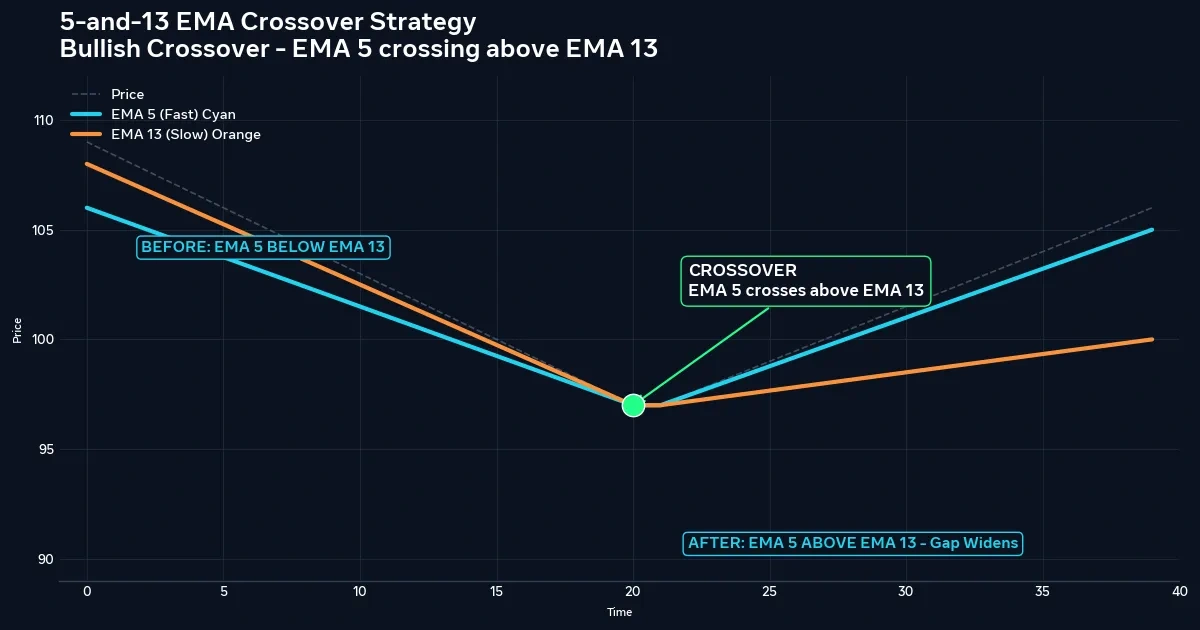
| Moving average crossover | Enter when a faster average crosses a slower one | Beyond a recent swing | Lag means a big part of the move is gone, and sideways markets cause repeated whipsaws |
Pullback Entries
A pullback entry buys a dip in an uptrend or sells a bounce in a downtrend. Traders commonly watch the area around a moving average, a trendline, a prior swing, or a Fibonacci retracement such as 38.2%, 50%, or 61.8% of the previous leg. The appeal is a tighter stop and a better reward-to-risk ratio. The cost is that you may miss strong trends that never pull back.
Breakout Entries
A breakout entry joins the trend as price moves past a prior high or low, or out of a tight consolidation. It captures strong moves that don’t pull back, but many breakouts fail, and the entry often comes after much of the move has happened. Waiting for a candle close beyond the level can reduce false signals but worsens the entry price.
Crossover Entries
Crossovers turn the trend definition into a mechanical signal, which is easy to test and automate. The longer-term version, the 50 and 200 moving average golden cross strategy, shows how much lag the approach accepts in exchange for filtering noise. Shorter combinations react faster but whipsaw more.
Where a Stop Belongs in a Trending Market
A trend trade needs room to breathe, because trends move in waves, not straight lines. Three common placements:
- Beyond the swing. In an uptrend, a stop below the most recent higher low means the trade is wrong if the trend structure breaks.
- A volatility multiple. Some traders set the stop at a multiple of ATR (Average True Range, the typical candle range) beyond entry, so the distance adapts to current volatility. The multiple is a choice to test, not a rule.
- A trailing stop. As price makes new highs, the stop is raised below each new higher low, or below a moving average, to protect open profit.
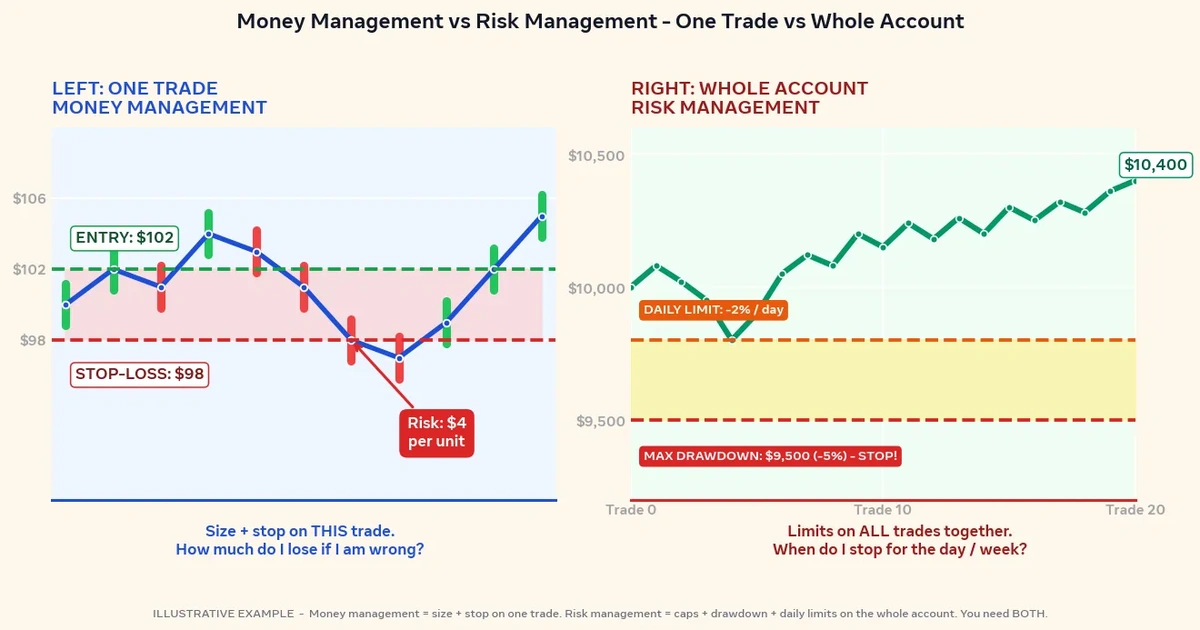
The trade-off is built in. A tight stop sits inside normal pullback noise and gets hit often. A wide stop survives noise but forces a smaller position to keep the dollar risk fixed. Whichever you choose, set the distance first and then size the trade, not the other way around.
A Lower High on the EUR/GBP 4-Hour Chart
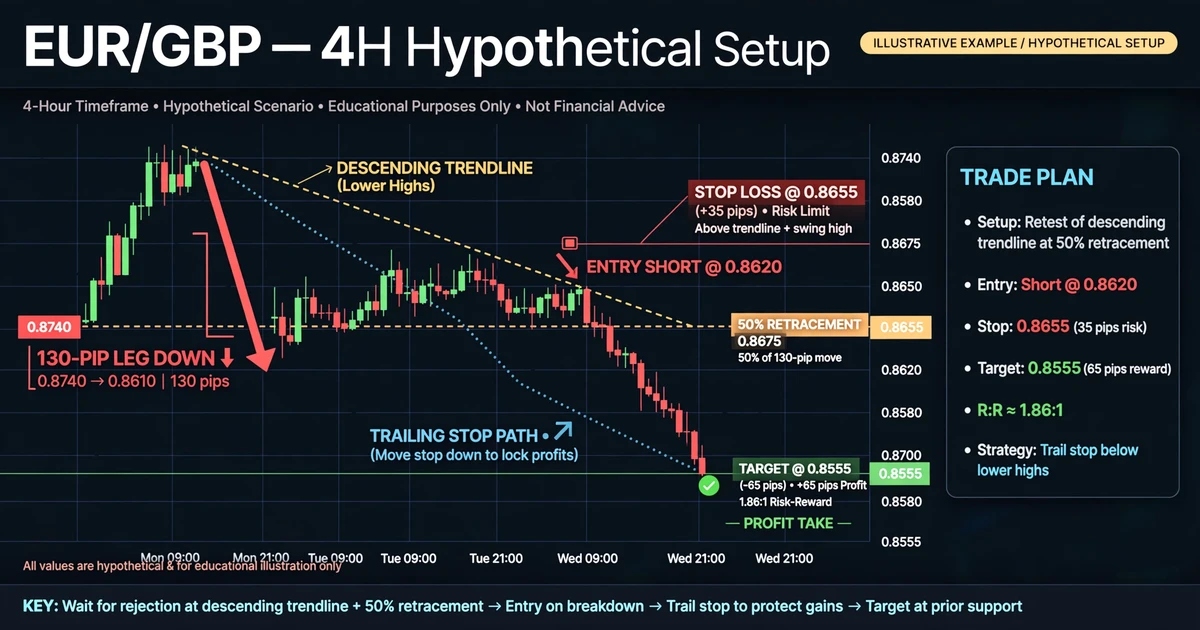
Imagine a trader with a £4,000 account who risks 1% (£40) per trade. EUR/GBP has been in a downtrend on the daily chart, so the plan is to look for shorts only. On the 4-hour chart, price fell from a swing high of 0.8530 to a swing low of 0.8400, a 130-pip leg, and has now bounced.
The bounce reaches 0.8468 and stalls at the 50% retracement (0.8530 − 0.0065 = 0.8465), right where a descending trendline sits. A bearish candle forms with a high of 0.8468 and closes at 0.8450. Because the bounce high is below the previous swing high of 0.8530, the structure of lower highs is intact.
This is a hypothetical example for illustration only.
The plan:
- Entry is a short at 0.8450.
- The stop is at 0.8470, above the bounce high, for 20 pips of risk.
- The target is 0.8390, ten pips below the old swing low, for 60 pips of reward, a 3:1 ratio.
The sizing: With the account in GBP and the pair quoted in GBP, one pip is worth £10 per standard lot. Position size is £40 ÷ (20 pips × £10) = 0.20 lots. A one-pip spread costs about £2 at that size.
Three ways it could play out:
- Stopped out. Price reverses to 0.8470 and the loss is 20 pips × £10 × 0.20 = £40, or 1% of the account.
- Target reached. Price falls to 0.8390 and the gain is 60 pips × £10 × 0.20 = £120.
- Trailed out. If the trader skips the fixed target and trails the stop above each new lower high, a bounce might stop the trade at 0.8410. That’s 40 pips, or £80.
The scenario also shows the real cost of a trend approach. Price could chop around 0.8450 for days, and the trade could end up flat, stopped out, or sitting through a news-driven spike in either direction.
Pullback or Reversal: Reading the Warning Signs
Every trend trader eventually buys a dip that turns out to be the start of a reversal. Some signs that a pullback may be more than a pause:
- Price breaks the previous swing low in an uptrend (or swing high in a downtrend), which ends the higher-low sequence.
- The retracement is unusually deep. Moves beyond roughly 61.8% of the prior leg are often treated as a warning, though that’s a convention, not a rule.
- Candles against the trend get larger and the ones with it get smaller, so momentum is shifting.
- The moving average flattens and price starts crossing it back and forth.
No single sign settles it. The practical response is to let your stop do the work. If the structure breaks, the trade is wrong, whatever the story you were telling yourself.
When the Trend Is Gone: Sideways Markets and False Starts
Trend trading loses money fastest in ranges, because signals trigger, reverse, and trigger again. Clues that you may be in a range include a flat moving average, an ADX below roughly 20, overlapping candles, and repeated rejections at the same highs and lows.
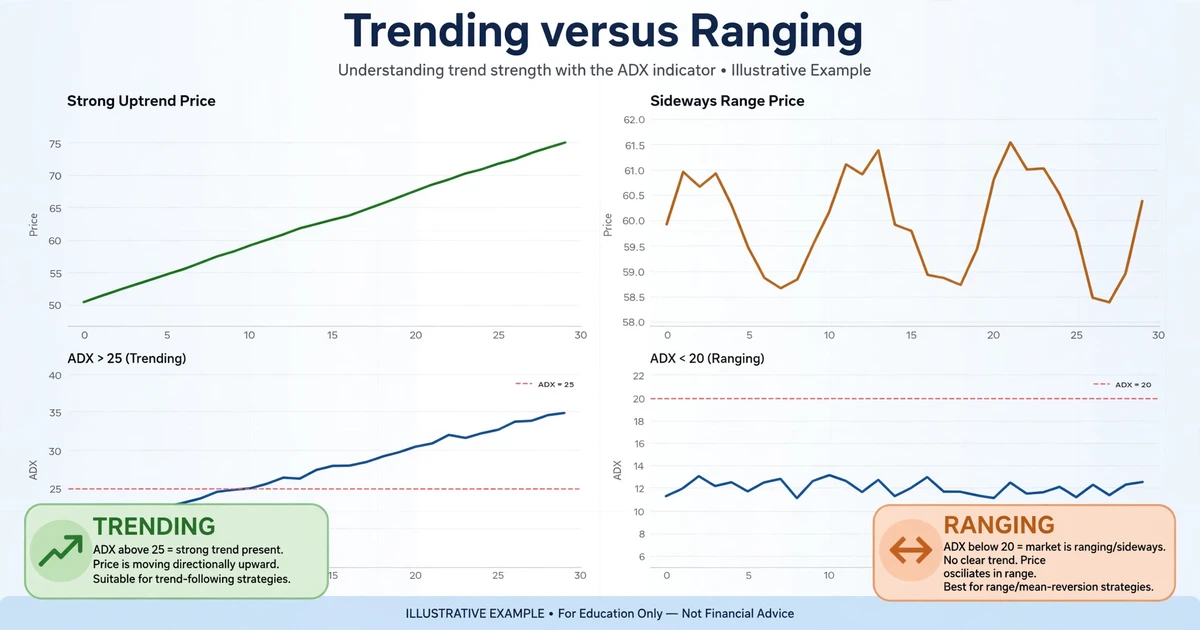
Many traders respond by pausing trend rules until a clear trend returns. Others switch to a different method suited to ranges, such as the one in range trading explained. Either way, the skill is recognizing that the environment has changed, and that is harder in real time than on a past chart.
Chasing Extended Moves and Other Habits That Drain Trend Traders
- Entering after a long run. Buying far above the moving average means a wide stop, a poor reward-to-risk ratio, and an entry near where profit-taking often begins.
- Fighting the higher timeframe. Taking 5-minute longs inside a clear daily downtrend is counter-trend trading in disguise.
- Dragging the stop closer to avoid a loss. A stop that moves toward price turns a planned loss into a probable one.
- Cutting winners early. Trend systems are often described as having a lower win rate and a larger average winner. Exiting at the first sign of fear removes the winners that pay for the losses.
- Adding to a losing position. Averaging down in a trend that has ended is how small losses become account-threatening ones.
- Calling every pullback a buying opportunity. Without structure, “buy the dip” is a hope, not a plan.
Whipsaws, Reversals, and Giving Back Open Profit: The Real Costs
- Whipsaw streaks. In sideways or transitioning markets, a trend approach can produce a series of small losses in a row. A string of losses is part of the method, and it tests your discipline.
- Open profit evaporates. Trailing stops give back part of a move before exiting, and a sharp reversal can reclaim gains in hours.
- News and gaps. A central bank decision or surprise headline can reverse a trend instantly. Weekend gaps can open beyond your stop, and the fill may be worse than planned (slippage).
- Leverage. Leverage magnifies both gains and losses, and a losing streak on a leveraged account can use up capital faster than most beginners expect.
- Adding to winners (pyramiding). Adding positions as a trend extends raises risk, because the average entry gets worse and a reversal hurts more.
- Backtest versus live. Testing on past charts overstates how cleanly trends were identified at the time, and settings tuned to history often weaken in live conditions.
- Psychological strain. Waiting through long flat periods, then watching a winner pull back, pushes traders to break their own rules.
Patience for Many Small Losses: Does This Fit You?
Trend trading tends to suit people who can sit through quiet stretches, accept a modest win rate in exchange for larger winners, and follow written rules when a trade is down. It’s a harder fit if you need frequent small wins to stay motivated, if you check charts only occasionally and can’t manage a trailing stop, or if you’d treat the slogan as a promise.
A simple way to test the fit is to run the method on a demo account for several weeks on one pair and one timeframe. Log direction, entry type, stop distance, and outcome for every trade, including the signals you skipped. Compare your results with your rules, not only with your profit, and treat anything under a few dozen trades as a clue rather than proof.
Pushback on the Slogan: Five Fair Questions
Does “the trend is your friend” always hold?
No. It describes a tendency, not a rule. Trends can end abruptly, markets spend long periods ranging, and the move you’re following may already be exhausted by the time you recognize it. The phrase is useful as a reminder to know the direction before trading, but it doesn’t remove the need for a stop-loss.
Which timeframe suits trend trading?
There’s no single answer. Higher timeframes like the daily or weekly have fewer signals and less noise but need wider stops and more patience. Lower timeframes offer more setups and more false signals. Many traders pick direction on a higher timeframe and time entries on a lower one. Choose based on how much time you can spend on charts.
How can I tell when a trend is ending?
Common warnings include a break of the last swing low in an uptrend (or swing high in a downtrend), a flattening moving average, and a fall in trend-strength readings such as ADX. None is certain on its own. Many traders rely on the stop-loss to define when the idea is wrong rather than trying to call the exact top.
Is trend trading beginner-friendly?
The idea is simple, but the practice isn’t easy. Identifying direction is straightforward on a finished chart, while enduring whipsaws and trailing stops live is difficult. Beginners usually do better with a demo account, one pair, a defined entry rule, and small risk per trade, so mistakes cost little while the skills develop.
What’s the difference between trend trading and counter-trend trading?
Trend trading takes positions in the direction of the prevailing move. Counter-trend trading tries to catch reversals, such as selling an uptrend near what looks like a top. Counter-trend setups are generally considered riskier because you’re trading against momentum, and stops can be hit before any turn happens. Some traders use them with smaller size and tighter rules.
A Slogan Is Only as Good as Its Exit Plan
“The trend is your friend” is a useful reminder to know the direction before you click, and a poor guide to when to leave. What separates a trend trade from a hope is a stop placed before entry and a rule for taking profit. For a next step, open the weekly chart of a pair you follow and write one sentence: “The trend is ___ because ___.” Then check whether the daily chart agrees. When you’re ready for a complete rule set, read our trend following strategy for beginners.
Disclaimer
This article is for educational purposes only and is not financial advice. Forex and CFD trading involves a high level of risk, and you can lose some or all of your capital. Leverage can magnify both gains and losses. Never trade with money you can’t afford to lose.
This is a trading framework, not a guarantee. No strategy wins every trade, and results vary with market conditions, execution, and risk management.
Any percentages or figures shown are historical averages or hypothetical examples, not guarantees. Past performance does not predict future results.
Join now
Comments (0)
Be the first to comment.