
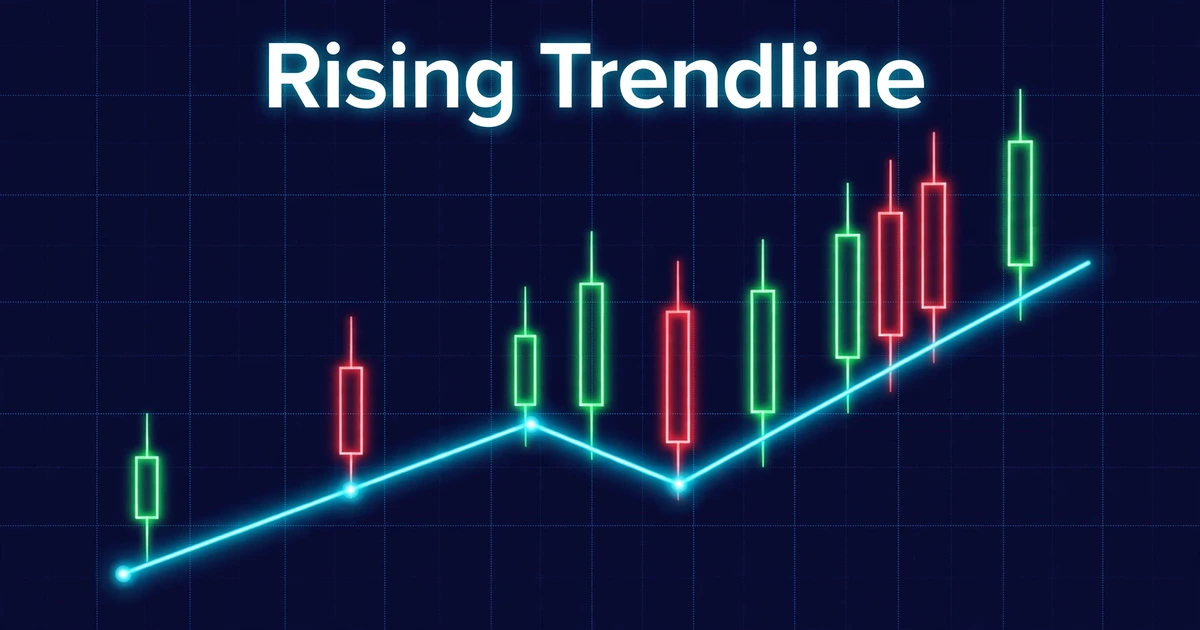
How to Draw Trendlines Correctly
Give five traders the same chart and ask for the trendline, and you’ll often get five different lines. Some connect wicks, some connect bodies, and some stretch a line through a dozen candles that clearly don’t fit it. Learning how to draw trendlines correctly means replacing that guesswork with a few repeatable rules.
This guide covers which points to pick, how many touches count, how to handle wicks, and how to tell a genuine break from a fake one. It ends with a hypothetical trade so you can see the math. A trendline is a way to read structure, not a prediction.
Quick Answer
- A trendline connects at least two swing lows in an uptrend, or two swing highs in a downtrend, and extends to the right.
- A third touch that holds is what many traders treat as the first real test of the line. Two points only define it.
- Choose one anchoring method (wicks or bodies) and apply it consistently, so your lines are comparable across charts.
- A line is broken by a candle close clearly beyond it, not by a wick that snaps back. Even then, breaks can fail.
What a Trendline Actually Measures
A trendline shows the pace at which a market has been rising or falling. In an uptrend, each pullback finds buyers a little higher than the last, and the line connects those pullback lows. In a downtrend, rallies fail a little lower each time, and the line connects those highs.
Because the line slopes, it acts as a moving area where buyers or sellers have stepped in before. That’s why traders call it dynamic support or resistance, as opposed to a flat horizontal level.
Two terms to settle first:
- Swing low / swing high: a candle low (or high) with clearly higher lows (or lower highs) on both sides. These are the anchor points.
- Touch: a candle that reaches the line and reacts, either by bouncing or by stalling.
A trendline doesn’t say the trend will continue. It records how far price has respected a slope so far.
Three Choices That Change the Line Before You Draw It
| Choice | Options | Trade-off |
|---|---|---|
| Timeframe | Higher (4-hour, daily) or lower (5-minute, 15-minute) | Higher timeframes give cleaner, longer-lasting lines but need wider stops. Lower timeframes give many lines that break often. |
| Anchor points | Obvious swing points or every small wiggle | Obvious swings produce fewer, sturdier lines. Wiggles let you fit a line to anything. |
| Anchor type | Wicks (extremes) or candle bodies (closing prices) | Wicks catch the full rejection. Bodies reduce the effect of news spikes. |
A habit that helps: start on a higher timeframe to find the big slope, then zoom in to refine entries. A line drawn on the 5-minute chart alone often disappears when you zoom out.
Step-by-Step: Drawing an Uptrend Line
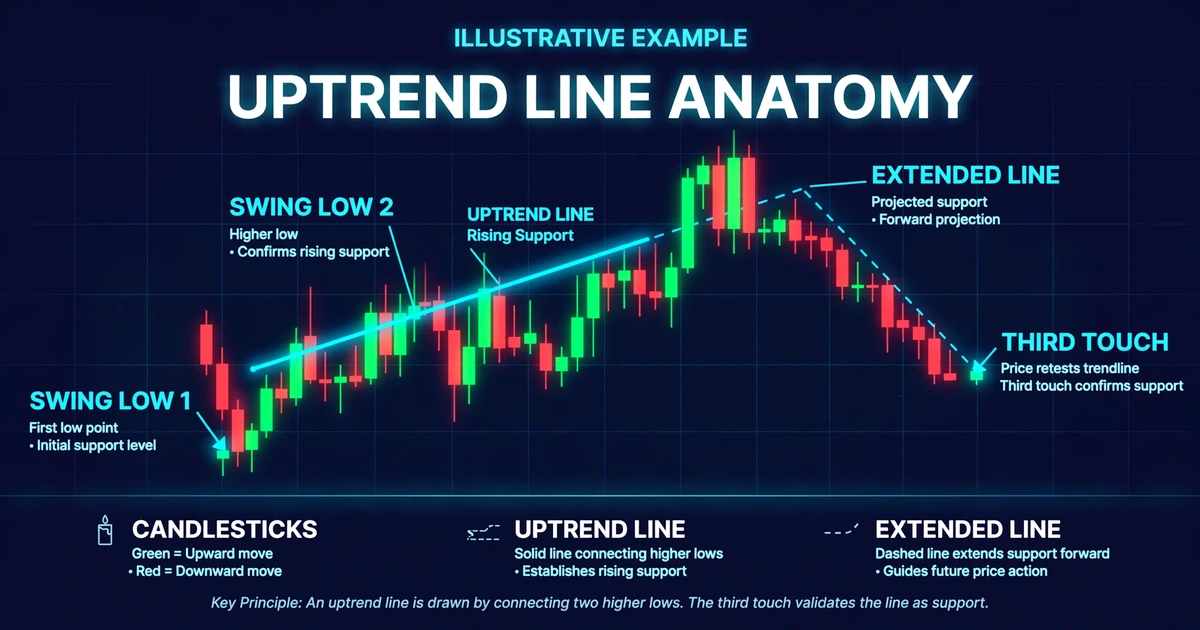
- Confirm there’s a trend. You should see a sequence of higher highs and higher lows. If the chart is moving sideways, there’s no slope to draw.
- Mark the first anchor. Use the lowest point of the move, usually the swing low where the advance began.
- Mark the second anchor. Choose the next clear swing low that sits higher than the first, with a rally between the two.
- Draw and extend. Run the line through both lows and extend it to the right so you can see where price may interact with it next.
- Check the stretch between the anchors. If candle bodies slice through the line between your two points, the line doesn’t fit the structure. Pick different anchors or accept there’s no clean line.
- Wait for a third touch. Until price returns and reacts at the line, it’s an untested idea.
For a downtrend line, mirror everything: connect swing highs that get progressively lower, and check that no bodies poke above the line between them.
What Makes a Line Stronger or Weaker
| Factor | Usually stronger | Usually weaker |
|---|---|---|
| Touches | Three or more clear reactions | Two points only |
| Time span | Spread across a meaningful stretch | Two points a few candles apart |
| Slope | Moderate, sustainable angle | Very steep angle |
| Fit | Few candles cutting through | Many bodies piercing the line |
| Location | Near a known horizontal level | Floating in open space |
Two caveats keep this honest. First, more touches isn’t always better: some traders argue a line that’s been tested many times is closer to breaking, because each test uses up the orders resting there. There’s no consensus. Second, very steep lines tend to be hard to sustain and break quickly, but no particular angle is a proven threshold.
Location matters more than most beginners expect. A trendline that meets a horizontal level where price has reacted before carries more weight than a lone line. For what separates a level worth respecting from one that isn’t, see strong vs weak support and resistance zones.
Wicks or Bodies: Picking a Rule and Sticking to It
Traders genuinely disagree here, and neither side is wrong.
- Wick-based lines capture the full reach of price. They show exactly where buyers or sellers stepped in, but a single news spike can distort the line.
- Body-based lines reflect where candles closed, which many traders view as the market’s settled opinion. They can look too clean and miss real rejections.
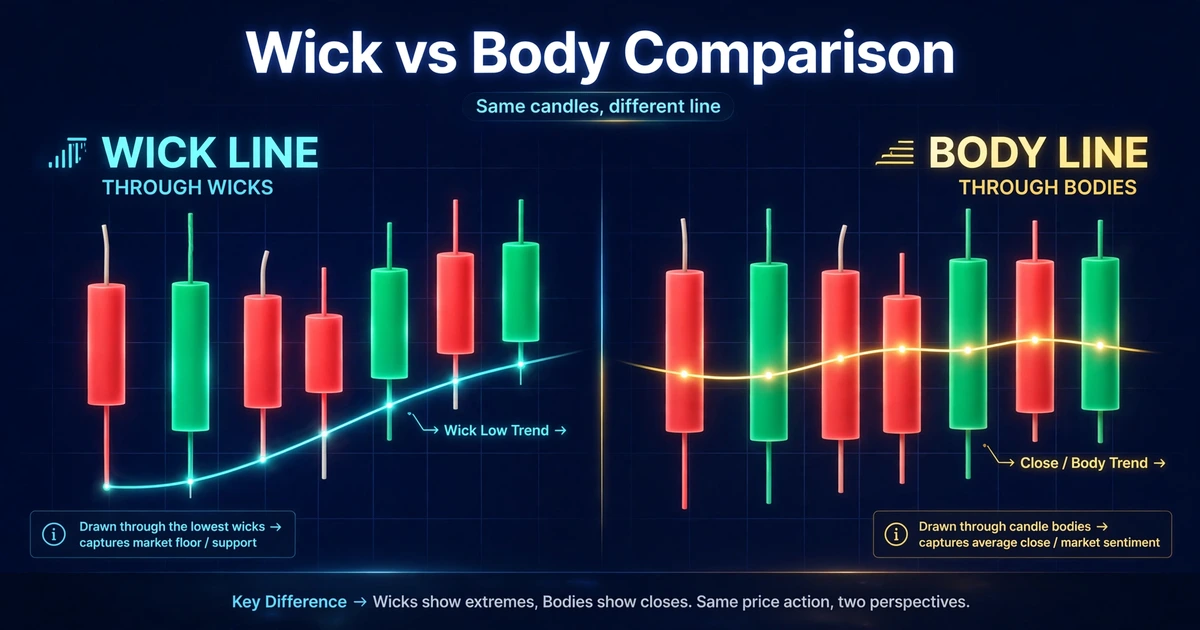
A practical compromise: draw through most of the touches and ignore a lone outlier spike that clearly came from a news release. Whichever method you use, write the rule down and apply it the same way every time. If you switch methods whenever a line fails, you can’t learn anything from the results.
Remember, too, that a daily candle’s close depends on your broker’s server time. Many brokers use 5 p.m. New York time, which shifts relative to GMT/UTC when daylight saving changes. If you draw on daily charts, check when your platform closes the candle.
Channels: Adding the Second Line
Once you have a trendline, you can draw a parallel line through the opposite swing points to form a channel. In an uptrend, the lower line connects swing lows and the upper line connects swing highs, so the channel brackets how far each advance and pullback has typically travelled.
Channels help you judge whether a move is stretched relative to its own history. They also have a failure mode: price often overshoots or falls short of the upper line, so don’t treat it as an exact target.
When the two lines converge instead of running parallel, you’re looking at a wedge or triangle. How to trade chart patterns covers those shapes and their breakout rules.
Reading a Break: Real Versus Fake
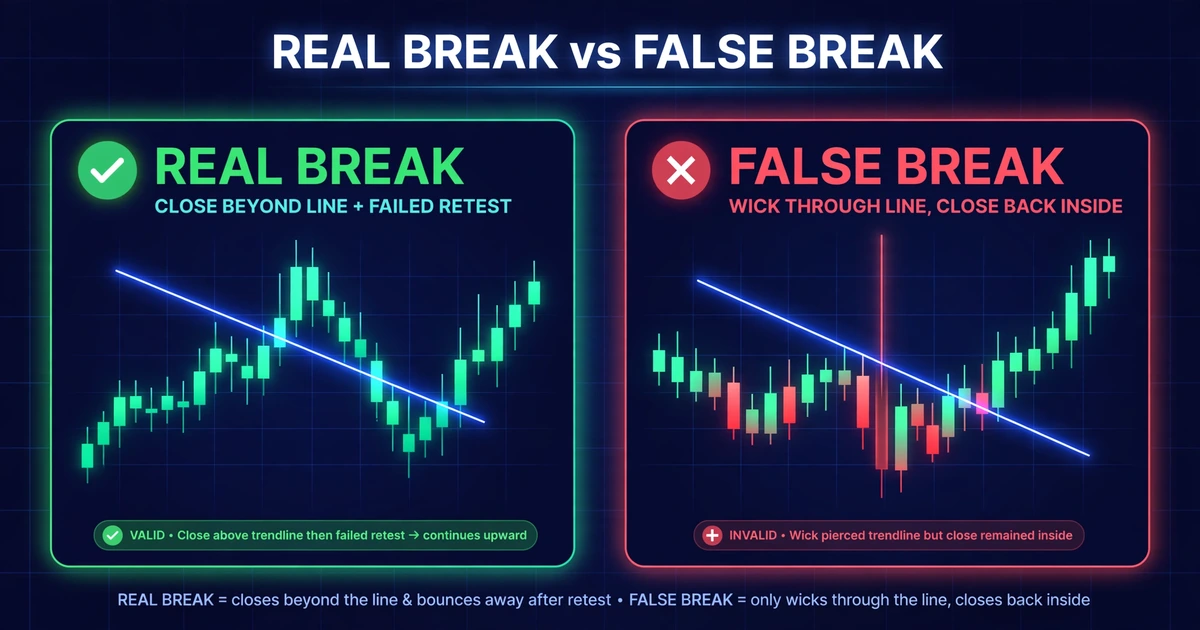
Most losses with trendlines don’t come from drawing the line. They come from misjudging what happens when price reaches it.
Signs of a more meaningful break:
- A candle closes clearly beyond the line, not just a wick.
- The candle is larger than recent candles, suggesting commitment.
- Price retests the line from the other side and fails to return (the old support now acts as resistance, or the reverse).
Signs of a possible false break:
- A long wick through the line, with the candle closing back on the original side.
- The move happens during a thin or news-driven period.
- The next candle immediately reverses.
When price touches a line, the shape of the candle there tells you a lot. A strong rejection candle reads very differently from a weak, indecisive one, and advanced candlestick patterns shows how to read those.
Even a retest-confirmed break can fail. Treat a break as a change in probabilities, not a certainty.
Hypothetical Walkthrough: Buying a Third Touch
This is a hypothetical example for illustration only, not a real trade or a current market view.
Assumptions:
- Pair: USD/JPY, 4-hour chart, USD account of $3,000
- Risk per trade: 1% = $30 (many traders risk a small fixed percentage; the right level depends on your situation)
- First swing low: 146.80. Second swing low, four days later: 147.60. That’s a rise of 80 pips over four days, or 20 pips per day.
- Projecting four more days ahead, the line sits at 147.60 + 0.80 = 148.40
Step 1: The third touch. A 4-hour candle wicks down to 148.32 (8 pips through the line), then closes at 148.52 with a high of 148.58. It’s a rejection candle, so you place a buy-stop just above its high at 148.60.
Step 2: Stop-loss. Place it below the wick’s low with a buffer: 148.32 − 0.22 = 148.10.
Step 3: Risk in pips. 148.60 − 148.10 = 0.50 = 50 pips. (On JPY pairs, one pip is 0.01.)
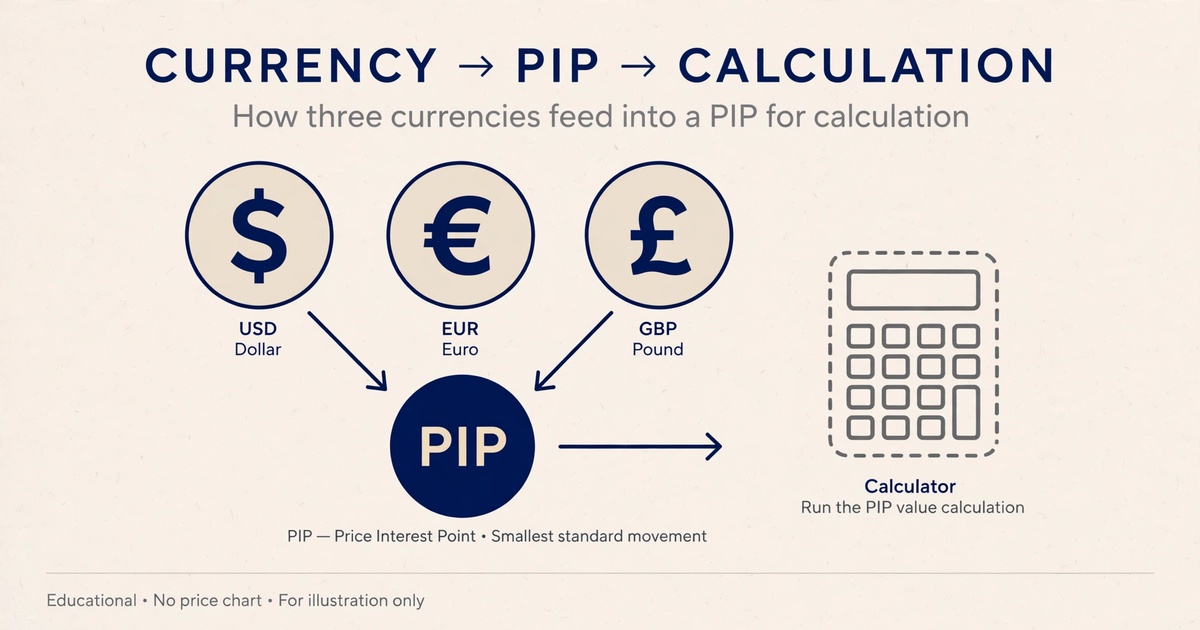
Step 4: Pip value. Pip value depends on the pair and your account currency. For USD/JPY with a USD account, one pip on 1,000 units (a micro lot) is 10 JPY, which at 148.60 equals 10 ÷ 148.60 ≈ $0.0673.
Step 5: Position size. $30 ÷ (50 pips × $0.0673) = 30 ÷ 3.365 = 8.9, rounded down to 8 micro lots. Actual risk: 8 × 50 × $0.0673 ≈ $26.92.
Step 6: Target. Suppose the previous swing high sits at 149.90. That’s 149.90 − 148.60 = 1.30 = 130 pips. Reward to risk: 130 ÷ 50 = 2.6 to 1.
Step 7: What invalidates it. A 4-hour close clearly below the line, or a stop hit. Spread, slippage and swap charges all reduce the real reward, and central bank announcements can move JPY pairs far past a planned stop.
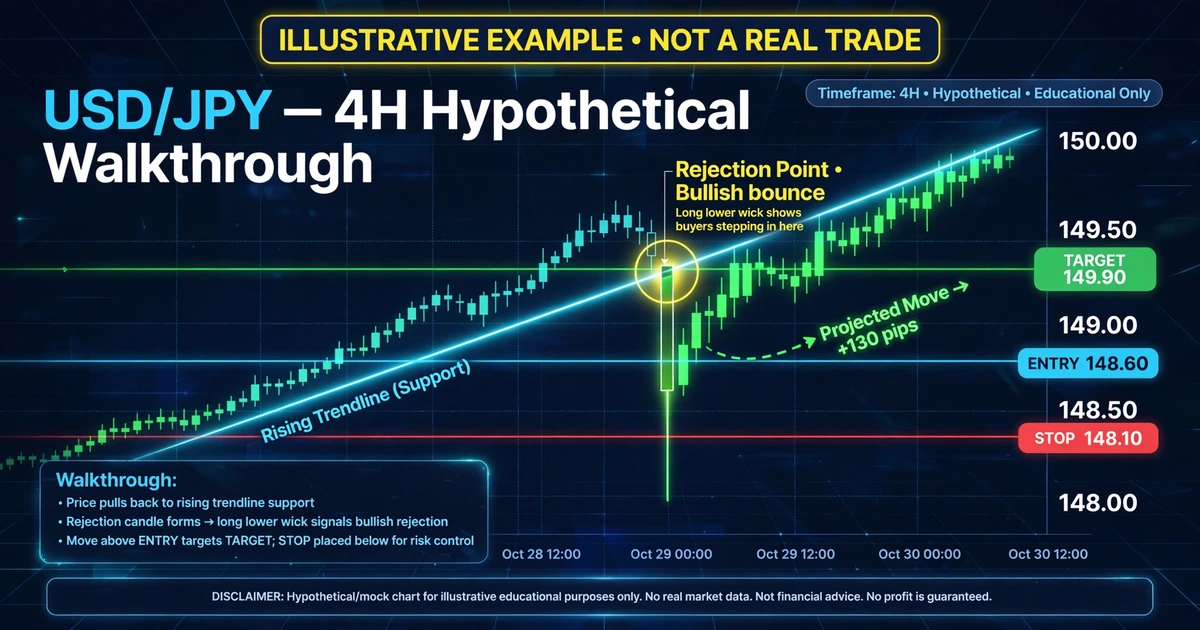
Notice how much of the trade was decided by the line’s quality and the stop’s distance, not by the entry itself.
Mistakes That Make Trendlines Useless
- Forcing the fit. If you’ve adjusted a line three times to catch more candles, you’re decorating the chart, not reading it.
- Drawing too many lines. A chart covered in sloped lines gives you a justification for any trade you want.
- Drawing after the fact. Lines drawn on a finished chart always look obvious. Mark them in real time, before you know what happens.
- Trusting a line because of the zoom level. Charts auto-scale. Zooming in or out changes how steep a line appears, so judge the slope by the market structure, not by how dramatic it looks on screen.
- Redrawing to avoid a loss. Moving a line after price breaks it hides the failure and ruins your ability to learn from it.
- Ignoring the trend’s age. A line that’s been intact for a long time and is now very steep is more likely to break than one that has just formed.
- Setting the stop exactly on the line. Price often pokes through slightly before reacting, so a stop with no buffer gets clipped by normal noise.
Risks and Limitations
- Subjectivity: Two traders can draw different lines on the same chart and both be defensible. That makes results hard to compare and easy to rationalize afterward.
- Hindsight bias: Trendlines drawn on historical charts look cleaner than they feel in real time, so reviewing old charts can overstate how well they work.
- False breaks: Price can close beyond a line and reverse within a few candles, stopping you out.
- Wide stops on slow lines: Lines on higher timeframes often require stops far from entry, which can make reward-to-risk unattractive or force a smaller position.
- Slippage and gaps: A position held over the weekend can open beyond your stop, and stop orders can fill at worse prices in fast markets.
- Leverage: Leverage magnifies losses as well as gains. An oversized position near a broken trendline can cause losses larger than planned, and in some cases you can lose the entire amount you deposited.
- Changing conditions: A trendline reflects the past slope. Market conditions can change quickly, and the slope may stop mattering.
Frequently Asked Questions
How many points do you need to draw a trendline?
Two points define a line, but most traders want a third touch that holds before trusting it. Two points can always be connected, so the line has only been fitted until price tests it. A third reaction gives you at least one piece of evidence.
Should I draw trendlines on wicks or candle bodies?
Both are used. Wicks show the full extent of rejection, while bodies reflect closing prices and reduce news-spike distortion. Neither is universally right. Pick one, apply it consistently, and don’t switch methods after a loss. Consistency lets you review your results fairly.
How do I know a trendline is broken?
Many traders look for a candle that closes clearly beyond the line, ideally larger than recent candles, followed by a failed retest from the other side. A wick that returns inside the line is often a false break. Even a confirmed break can fail, so keep a stop in place.
Which timeframe is best for trendlines?
Higher timeframes like the 4-hour and daily usually produce cleaner, longer-lasting lines but need wider stops. Lower timeframes give many lines that break often. A common approach is drawing the main line on a higher timeframe and fine-tuning entries on a lower one.
Should I delete old trendlines?
Keep a line while it still fits the current structure. Once price breaks it decisively and the trend changes, remove or relabel it so it doesn’t clutter your chart. Save a screenshot first if you’re journaling, so you can review how the line behaved.
A Line Is a Hypothesis
A trendline is a claim that price will keep respecting a slope, and each touch tests that claim. Drawing it correctly mostly means choosing clear anchors, applying one consistent rule and being honest when price breaks it.
For your next step, pick one chart and mark ten past trends in real time, using only the information visible at each point. Count how many lines held at the third touch. Then see how those lines feed into a full approach in trend trading explained.
Disclaimer
This article is for educational purposes only and is not financial advice. Forex and CFD trading involves a high level of risk, and you can lose some or all of your capital. Leverage can magnify both gains and losses. Never trade with money you can’t afford to lose.
This is a trading framework, not a guarantee. No strategy wins every trade, and results vary with market conditions, execution, and risk management.
Join now
Comments (0)
Be the first to comment.