
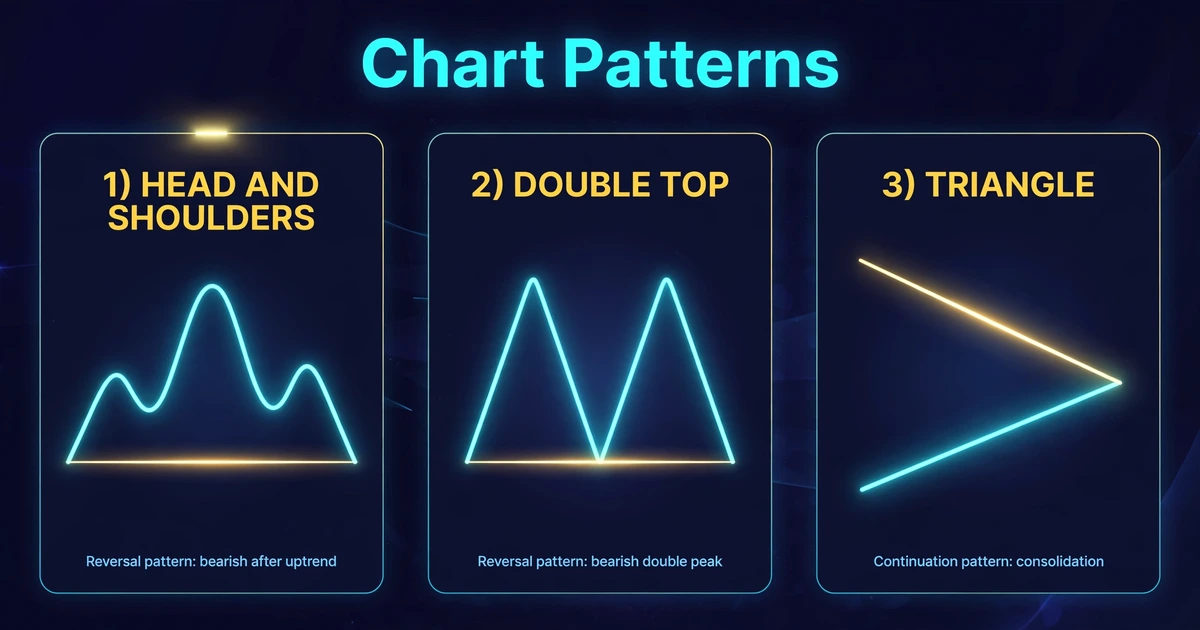
How to Trade Chart Patterns: Head and Shoulders, Double Tops, and Triangles
A head and shoulders isn’t a sell signal. It’s an unfinished drawing until price closes through the neckline, and plenty of them never get there. They stall, drift sideways, or turn into something else entirely. That gap between “this looks like a pattern” and “this pattern has actually triggered” is where most losses happen.
This guide shows you how to trade chart patterns in a rule-based way. You’ll see how head and shoulders, double tops and triangles are built, where entries, stops and targets usually go, and when to walk away.
Quick Answer
- Chart patterns are shapes formed by price over many candles. They show a contest between buyers and sellers that’s either reversing (head and shoulders, double tops) or pausing (triangles).
- A pattern isn’t tradable until it breaks its key line: the neckline or the triangle boundary. Many traders wait for a candle close beyond it.
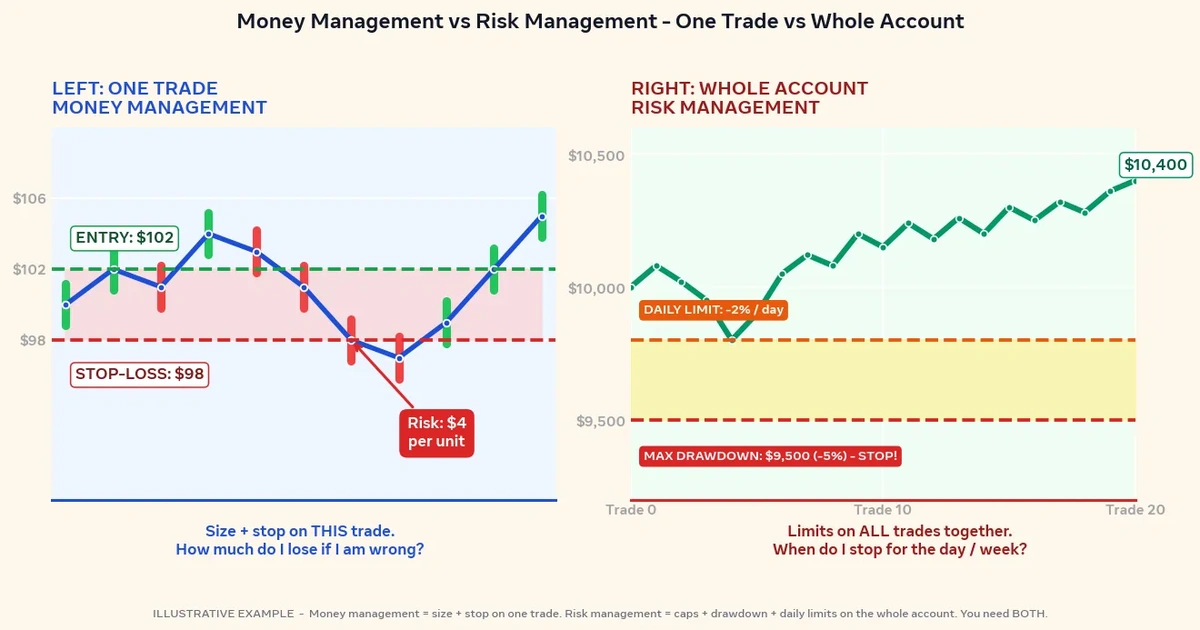
- Place your stop on the other side of the pattern’s structure, and size the position from that distance, not the other way around.
- If the distance to a sensible target isn’t comfortably larger than the distance to your stop, skip the trade.
What a Chart Pattern Is Actually Showing
Candlestick patterns describe one to five candles. Chart patterns stretch across dozens. Where a candle pattern is a quick snapshot (the advanced candlestick patterns guide covers those), a chart pattern shows a longer story: who pushed price, who pushed back, and where the balance may be shifting.
Every pattern in this guide is built from the same few parts:
- Prior trend: reversal patterns need something to reverse. A head and shoulders in a sideways market has little meaning.
- Key line: the neckline or a triangle’s boundary. Price must cross it for the pattern to count.
- Breakout: the move beyond that line. A close beyond it carries more weight than a wick poking through.
- Measured move: a rough target found by projecting the pattern’s height from the breakout point. It’s a guideline, not a promise.
Head and Shoulders: Anatomy and Trade Rules
How the pattern forms
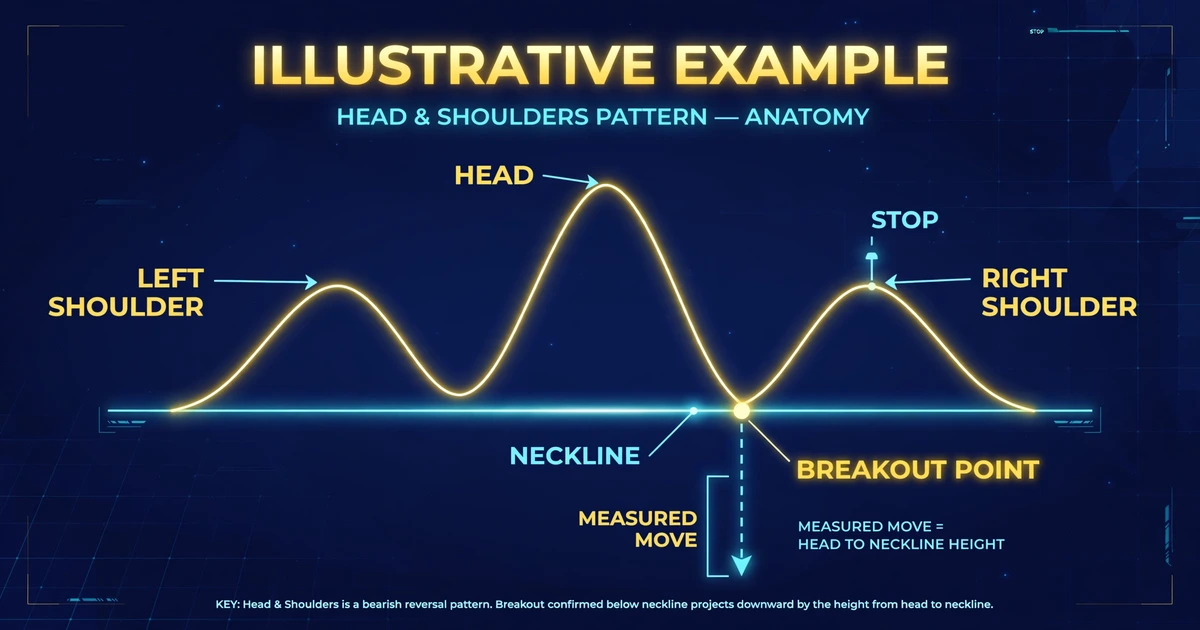
A head and shoulders top appears after an advance and has three peaks: a left shoulder, a higher peak (the head), and a right shoulder that’s roughly level with the left one. The neckline is the line connecting the two pullback lows between those peaks. It can slope slightly up or down.
The story: buyers push to a new high (the head), but the next rally (the right shoulder) fails to match it. Momentum has faded, and the neckline is the last line of defense.
An inverse head and shoulders is the same shape flipped upside down after a decline, suggesting a possible turn upward.
Typical trade rules
These are common conventions, not laws:
- Entry: after a candle closes beyond the neckline, or after a retest of the neckline from the other side. A direct entry on the break gets you in earlier but with more false-break exposure. A retest entry has a cleaner stop but sometimes never comes, so you miss the trade.
- Stop-loss: above the right shoulder’s high (for a top), with a small buffer. If price returns above the right shoulder, the pattern’s logic is broken.
- Target: the vertical distance from the head to the neckline, projected downward from the breakout point.
- Skip condition: if the neckline is very steep, the shoulders are wildly uneven, or the target is too close to the stop, many traders pass.
Double Tops and Double Bottoms
A double top is two peaks at about the same price with a trough between them. The trough’s low forms the neckline. A double bottom is the mirror image: two lows with a peak between.
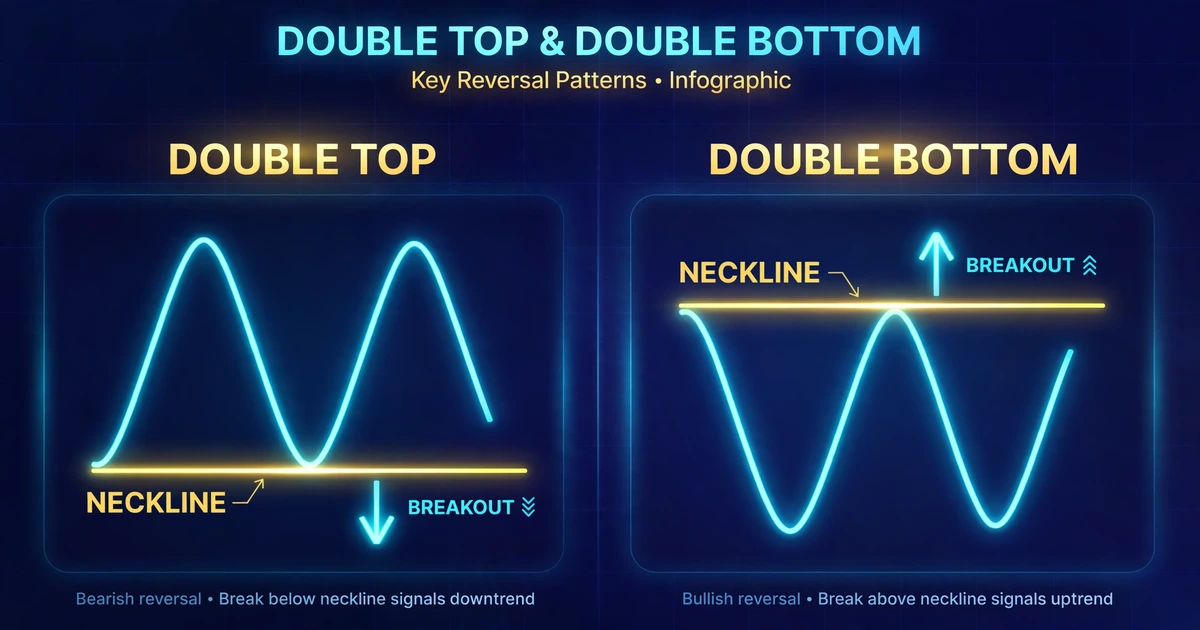
The idea is that price tested the same ceiling (or floor) twice and failed both times. If it then breaks the neckline, traders read that as the test result being confirmed.
Practical details that help:
- The two peaks don’t need to match to the pip. A rough rule is “close enough that a reasonable observer would call them equal” given the pair’s normal volatility.
- Very short gaps between the two peaks (only a few candles) often reflect noise rather than a real test.
- The same entry, stop and target approach used for head and shoulders applies: entry on a neckline break or retest, stop beyond the second peak, and a target equal to the pattern’s height projected from the neckline.
A common trap: price often makes a third attempt at the level. A double top that becomes a triple top is still valid, but a trader who entered early on the second peak is already stopped out.
Triangles: Compression Before the Break
Triangles form when swings get smaller, squeezing price between two converging lines. They don’t predict direction on their own. They show that the market is coiling.
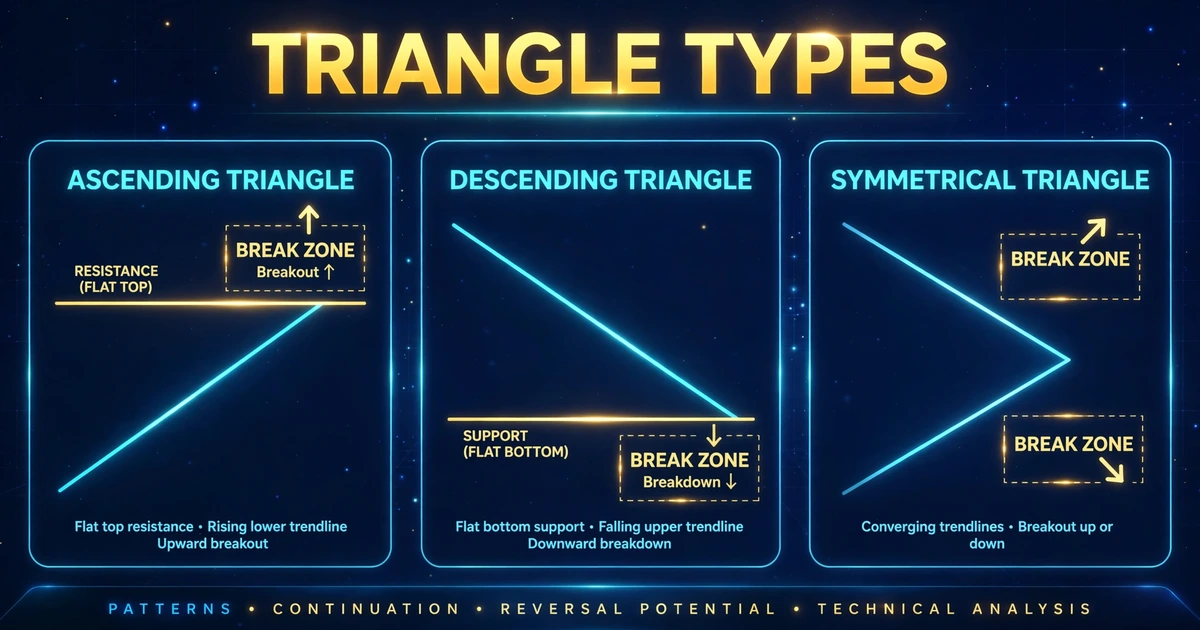
| Type | Shape | Common reading |
|---|---|---|
| Ascending | Flat top, rising bottom | Buyers keep stepping in higher; often watched for an upside break |
| Descending | Flat bottom, falling top | Sellers keep stepping in lower; often watched for a downside break |
| Symmetrical | Both lines converging | Neutral; trade whichever side breaks |
“Often watched for” is deliberate wording. Ascending triangles break down, and descending triangles break up, often enough to hurt traders who assumed otherwise.
Rules for triangles
- Wait for a close beyond a boundary line. The apex (where the lines would meet) is a poor place to trade, since breakouts that arrive very close to it tend to lose momentum.
- Place the stop on the other side of the last swing inside the triangle, not at the far boundary.
- Estimate the target by projecting the triangle’s widest height from the breakout point.
- Draw your lines with at least two touches on each side. If you need to bend them to fit, the triangle isn’t there. The guide on how to draw trendlines correctly covers how to avoid forcing lines.
Pattern Comparison at a Glance
| Pattern | Type | Key line | Invalidation (common) | Target method |
|---|---|---|---|---|
| Head and shoulders | Reversal | Neckline | Price closes back above right shoulder | Head-to-neckline height |
| Inverse H&S | Reversal | Neckline | Price closes back below right shoulder | Head-to-neckline height |
| Double top/bottom | Reversal | Middle trough/peak | Break of the second peak/trough | Peak-to-neckline height |
| Ascending triangle | Usually continuation | Flat resistance | Close below the last higher low | Widest height |
| Descending triangle | Usually continuation | Flat support | Close above the last lower high | Widest height |
| Symmetrical triangle | Either | Both lines | Break of the last swing on the opposite side | Widest height |
Rules That Apply to Every Pattern
Confirm with a close, not a touch. A wick through the line that snaps back is exactly how false breakouts look. A candle close beyond the line is a stronger, though still imperfect, filter.
Check the location. A double top directly under a level that has rejected price before is more meaningful than one in open space. For what separates a level worth respecting from one that isn’t, see strong vs weak support and resistance zones.
Use the right timeframe. Patterns on the 4-hour and daily charts tend to be cleaner and need wider stops. Patterns on 1- and 5-minute charts form quickly, but spread and noise can overwhelm them.
Treat forex volume carefully. Spot forex has no central volume figure. Platforms show tick volume, which counts price changes, not traded size. It can hint at activity, but it isn’t the same as exchange volume in stocks.
Know your candle close time. Daily candles close according to your broker’s server time. Many use 5 p.m. New York time, which moves relative to GMT/UTC with daylight saving changes. A “daily close” through the neckline means different things on different platforms.
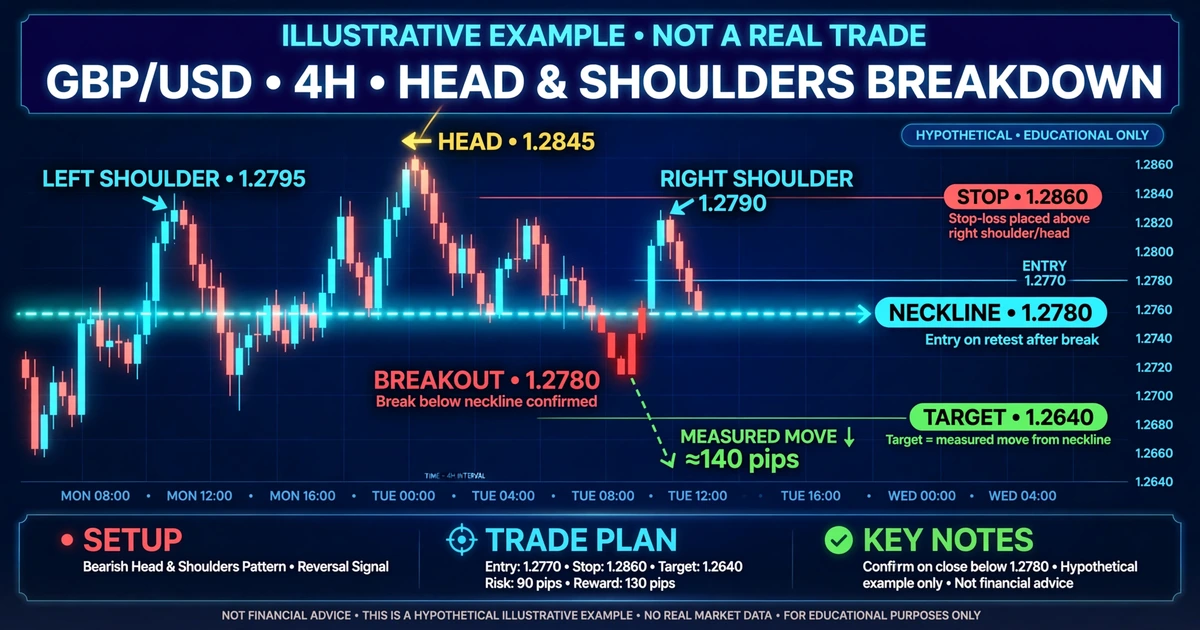
Hypothetical Walkthrough: Head and Shoulders Short
This is a hypothetical example for illustration only, not a real trade or a current market view.
Assumptions:
- Pair: GBP/USD on a 4-hour chart, USD account of $8,000
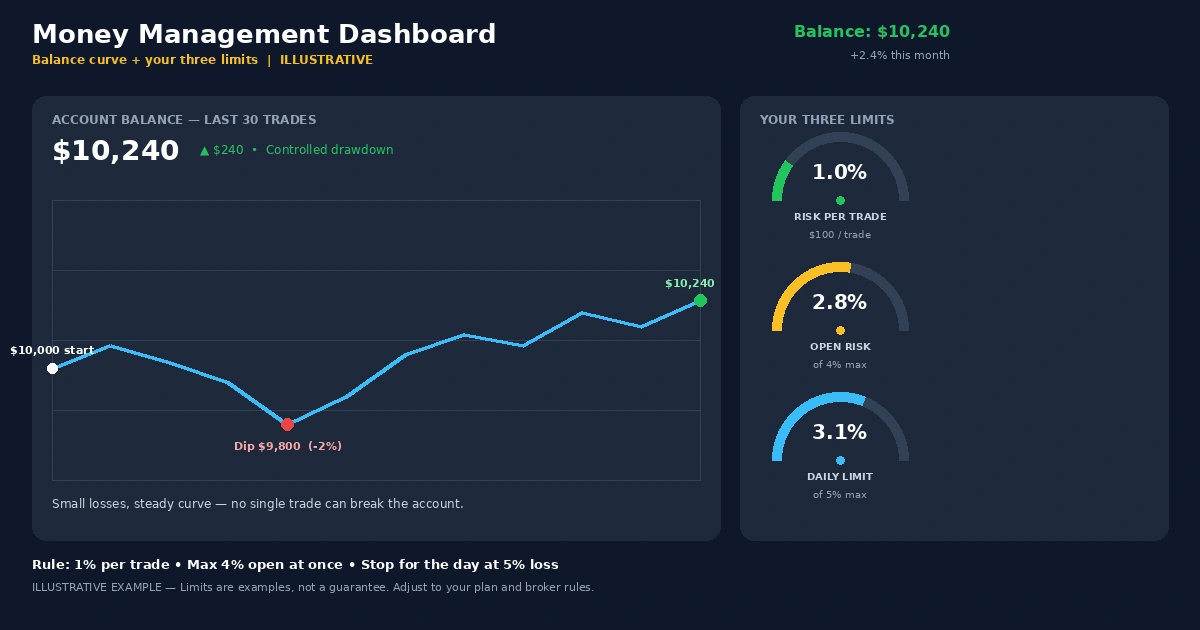
- Risk per trade: 0.5% = $40 (many traders risk a small fixed percentage; the right level depends on your situation)
- A rally produces a left shoulder high at 1.2850, a head at 1.2920 and a right shoulder at 1.2855
- Both pullback lows sit near 1.2780, forming the neckline
Step 1: Trigger. A 4-hour candle closes at 1.2772, below the neckline. You sell at 1.2770.
Step 2: Stop. Place it 5 pips above the right shoulder’s high: 1.2855 + 0.0005 = 1.2860.
Step 3: Risk in pips. 1.2860 − 1.2770 = 0.0090 = 90 pips.
Step 4: Position size. On GBP/USD with a USD account, one pip is about $10 per standard lot, or $0.10 per micro lot.
$40 ÷ (90 pips × $0.10) = 4.44, rounded down to 4 micro lots.
Actual risk: 4 × 90 × $0.10 = $36.
Step 5: Target. Head-to-neckline height: 1.2920 − 1.2780 = 0.0140 = 140 pips. Projected down from the neckline: 1.2780 − 0.0140 = 1.2640. From your entry at 1.2770, that’s 130 pips.
Step 6: Reward vs. risk. 130 ÷ 90 ≈ 1.4 to 1. That’s a thin margin for a pattern that can fail. Some traders would skip it, look for a retest entry with a tighter stop, or take partial profits earlier. Whatever you choose, decide before entering, not after.
Spread, slippage and any swap charges on a trade held across sessions would reduce the real reward further. For a broader look at sizing and loss limits, the forex risk management complete guide goes deeper.
Quick Triangle Example
Hypothetical example for illustration only.
An ascending triangle forms on USD/CAD with flat resistance at 1.3600 and rising support that started near 1.3500, so the widest height is about 100 pips. Price closes above 1.3600 and you buy at 1.3610. The last higher low inside the triangle was 1.3565, so your stop goes there: 1.3610 − 1.3565 = 45 pips.
The measured target is 1.3600 + 0.0100 = 1.3700, which is 90 pips from entry. Reward to risk: 90 ÷ 45 = 2 to 1. That clears a common minimum some traders use, though a breakout can still fail and reverse straight back into the triangle.
Where Chart Pattern Trades Go Wrong
- Calling the pattern too early. A “right shoulder” that hasn’t finished forming is just a pullback. Wait for the structure.
- Forcing the neckline. If you adjust the line three times to make it fit, you’re trading a hope.
- Ignoring the prior trend. A head and shoulders after a flat, choppy stretch has little to reverse.
- Entering on a wick. A spike through the neckline that closes back inside is a classic false break.
- Using an oversized stop with a normal-sized position. Pattern stops are often wide. If your position isn’t sized from the stop distance, your risk is larger than you planned.
- Chasing after a big candle. If the breakout candle already covered most of the measured move, there may be little left.
- Treating the measured move as a target price. Price may stop short, overshoot, or reverse before reaching it.
Who Should Skip This Approach
Chart patterns may not suit you if you can’t tolerate wide stops relative to a small account, if you tend to second-guess a plan once a trade is open, or if you don’t have time to wait for a full pattern and a candle close. They also demand patience, since many setups never meet your rules and the right answer is no trade at all. If you’re still learning to read basic structure, consider spending more time with price action trading fundamentals before adding pattern rules on top.
Risks and Limitations
- Subjectivity: Two traders can draw the same chart differently. Whether something is a double top or just two highs is partly a judgment call.
- False breakouts: Price can close beyond a line and reverse within a few candles, stopping you out at a loss.
- Patterns evolve: A potential head and shoulders can turn into a larger range or a continuation, and an unfinished pattern can’t be known in advance.
- Wide stops, thin rewards: As the walkthrough shows, a large pattern can produce a stop distance that makes the reward-to-risk ratio unattractive.
- Gaps and slippage: Positions held over the weekend can open away from your stop. Breakout orders placed during news can fill at much worse prices.
- Leverage: Leverage magnifies losses as well as gains. An oversized position on a wide-stop pattern trade can cause losses well beyond your plan, and in some cases you can lose the entire amount you deposited.
- Hindsight bias: Patterns look obvious on finished charts, which makes historical results look better than live trading usually feels.
- No guaranteed targets: Measured moves are a convention, and price often stops short or goes further.
Frequently Asked Questions
What is the easiest chart pattern to start with?
Double tops and double bottoms are often the simplest to spot because they involve just two swings and one neckline. Whichever you choose, mark past examples first, including failures, before you consider trading it with real money.
Should I enter on the breakout or wait for a retest?
Both have trade-offs. Entering on the close beyond the line gets you in earlier but exposes you to false breaks. Waiting for a retest often gives a tighter stop, but price may never return, and you miss the move. Pick one approach and test it.
What timeframe works best for chart patterns?
The 4-hour and daily charts tend to produce cleaner patterns with fewer false signals, but they need wider stops and more patience. Shorter timeframes produce patterns faster, but spreads and noise can dominate. Test your chosen timeframe on a demo account first.
How do I set a target for a pattern?
Most traders use the measured move: the pattern’s height projected from the breakout point. Others aim for the next support or resistance level instead. Either way, treat it as an estimate, and check whether reward clearly outweighs risk before entering.
Do chart patterns work without real volume data?
Price structure itself doesn’t depend on volume, so patterns can still be drawn and tested. Tick volume on forex platforms offers a rough sense of activity, but it isn’t equivalent to exchange volume, so avoid treating it as confirmation on its own.
How long does a pattern take to form?
There’s no fixed length. A pattern should be proportional to the timeframe: a few hours on a 15-minute chart, days or weeks on a daily chart. Very rushed patterns, where the “peaks” are only a few candles apart, often reflect noise.
Draw It, Wait for the Close, Then Do the Math
The reliable habit behind every pattern here is a short checklist: confirm the prior trend, draw the key line, wait for a close beyond it, size from the stop and check reward against risk. If any step fails, there’s no trade.
Your next step: open a chart and mark five head and shoulders or double tops from the past, noting where the stop would have gone and what the measured move would have been. Then write down how many met your reward-to-risk minimum. That number tells you more than any rule of thumb in an article.
Disclaimer
This article is for educational purposes only and is not financial advice. Forex and CFD trading involves a high level of risk, and you can lose some or all of your capital. Leverage can magnify both gains and losses. Never trade with money you can’t afford to lose.
This is a trading framework, not a guarantee. No strategy wins every trade, and results vary with market conditions, execution, and risk management.
Join now


Comments (0)
Be the first to comment.