
What Is Price Action Trading? A Complete Beginner’s Guide
Picture a 15-minute chart with six indicators stacked on it, three of them disagreeing, and a trader frozen in front of the screen. Price action trading starts from the opposite idea: strip the chart down and read what price itself has done. That means where it turned, how hard it pushed, and where it stalled. This guide shows beginners what price action trading is, which parts of the chart it relies on, how a simple setup gets built, and where the approach falls short. Nothing here is a signal or a promise of results. It’s a reading skill you can practice.
Trading From the Bare Chart: The Short Version
- Price action trading means making decisions from price movement itself (swing highs and lows, candles, and support and resistance zones) instead of from indicator signals.
- Most traders read four things: market structure, horizontal zones, candle behavior, and trendlines.
- A basic setup combines a zone, a candle signal, a stop-loss placed beyond the idea’s failure point, and a target at the next logical level.
- It’s discretionary, so two traders can read the same chart differently. Test it on a demo account first.
The Four Things a Price Action Trader Watches
Price action doesn’t mean “no tools.” It means the tools are drawn from price, not calculated from it. Most beginners start with these four.
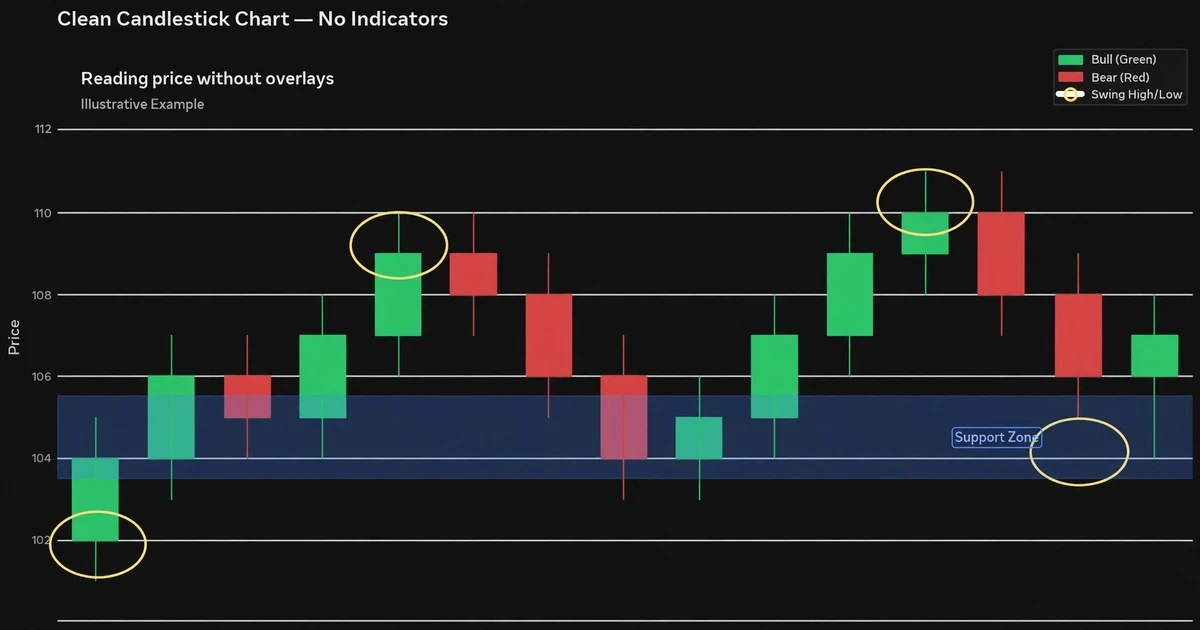
Swing highs and swing lows
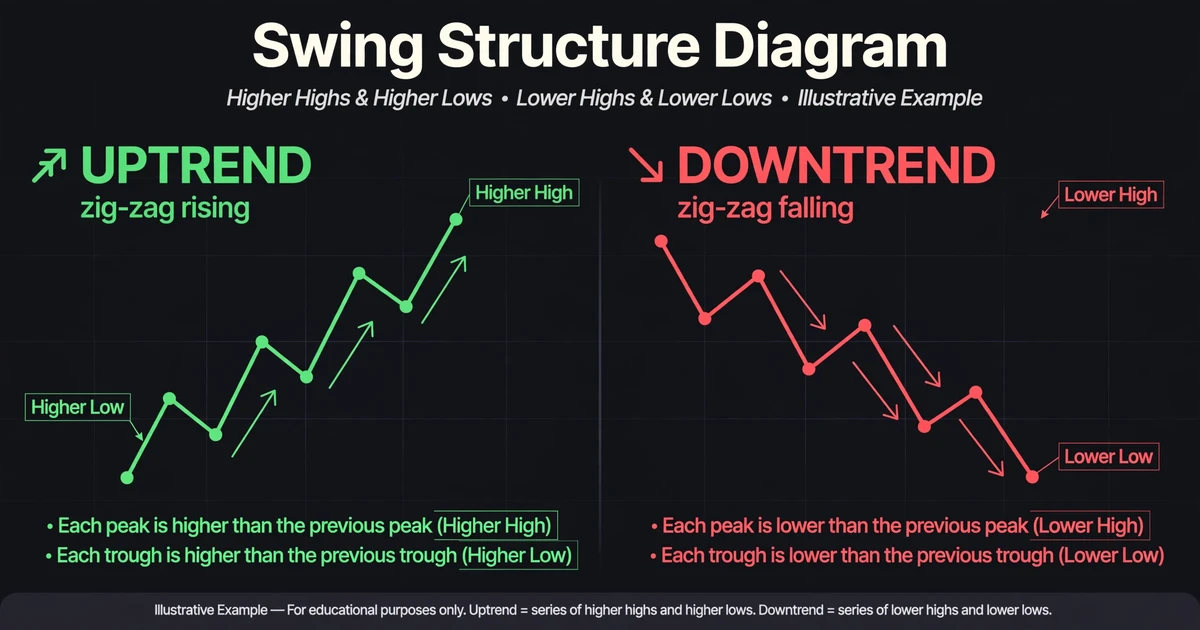
A swing high is a peak with lower prices on both sides. A swing low is a trough with higher prices on both sides. Linking them shows the market’s structure: whether buyers or sellers have been controlling the moves.
Horizontal zones where price reacted
Areas where price stalled or reversed before often attract attention again. Traders mark them as zones, not razor-thin lines, because reactions rarely land on one exact price. The guide on strong vs weak support and resistance zones covers how to judge which zones deserve your attention.
Candle behavior
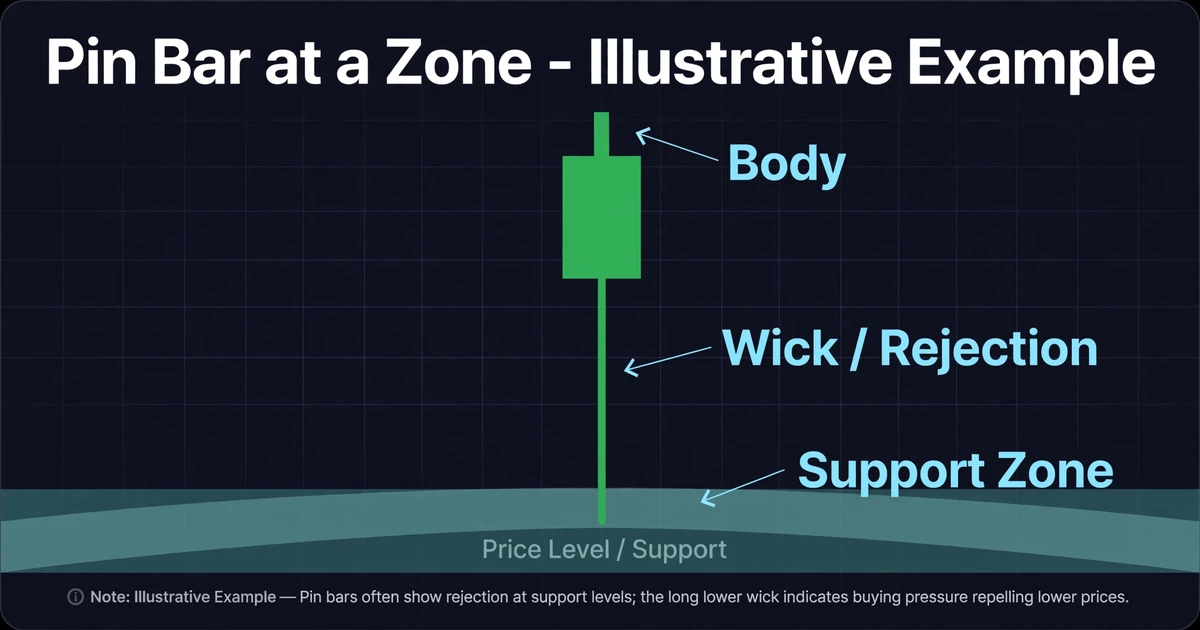
Each candle summarizes a period: open, high, low, and close. A long wick means price pushed somewhere and got rejected. A large body that closes near its high means one side dominated that period. A single candle is a clue, not a verdict.
Trendlines
A line connecting rising lows or falling highs shows slope and pace. Drawing one consistently matters more than drawing it prettily, and how to draw trendlines correctly walks through the choices that change the line.
Why Some Traders Prefer a Cleaner Chart
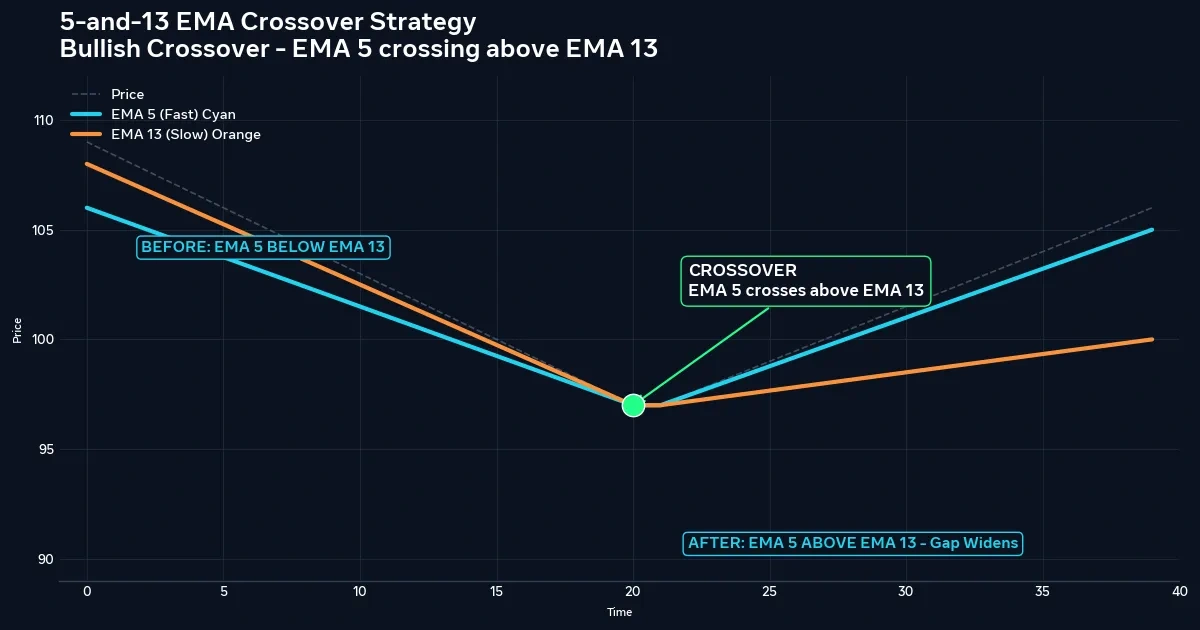
Indicators such as moving averages and oscillators are calculated from past prices, so they trail what the chart has already shown. Price action traders argue that reading the source saves a step and avoids clutter.
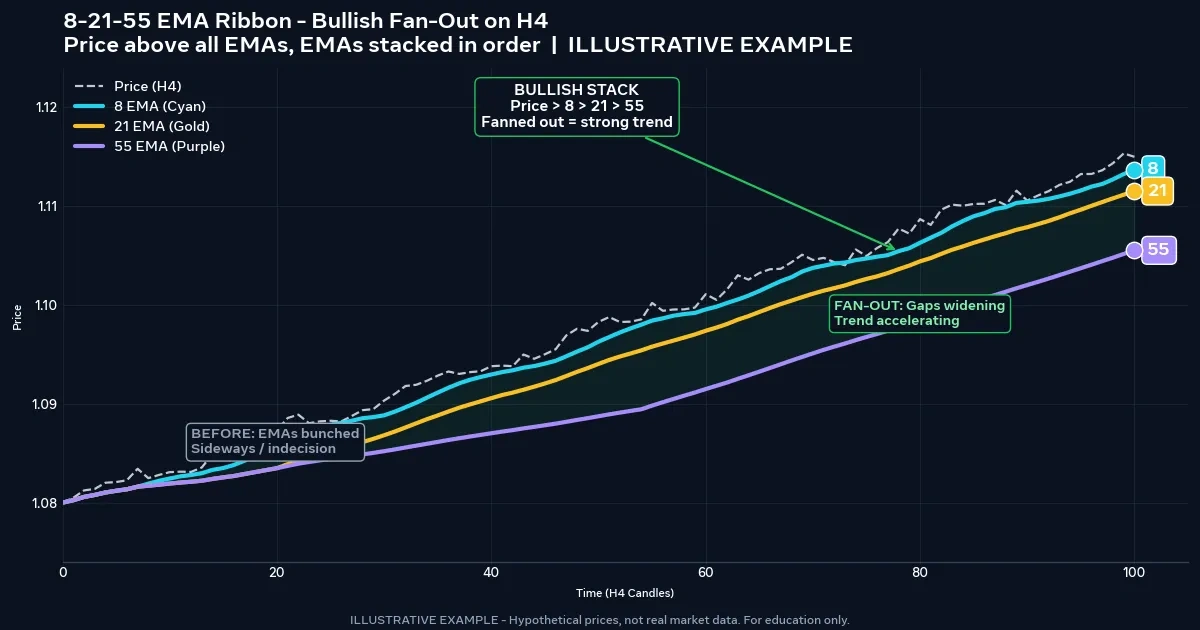
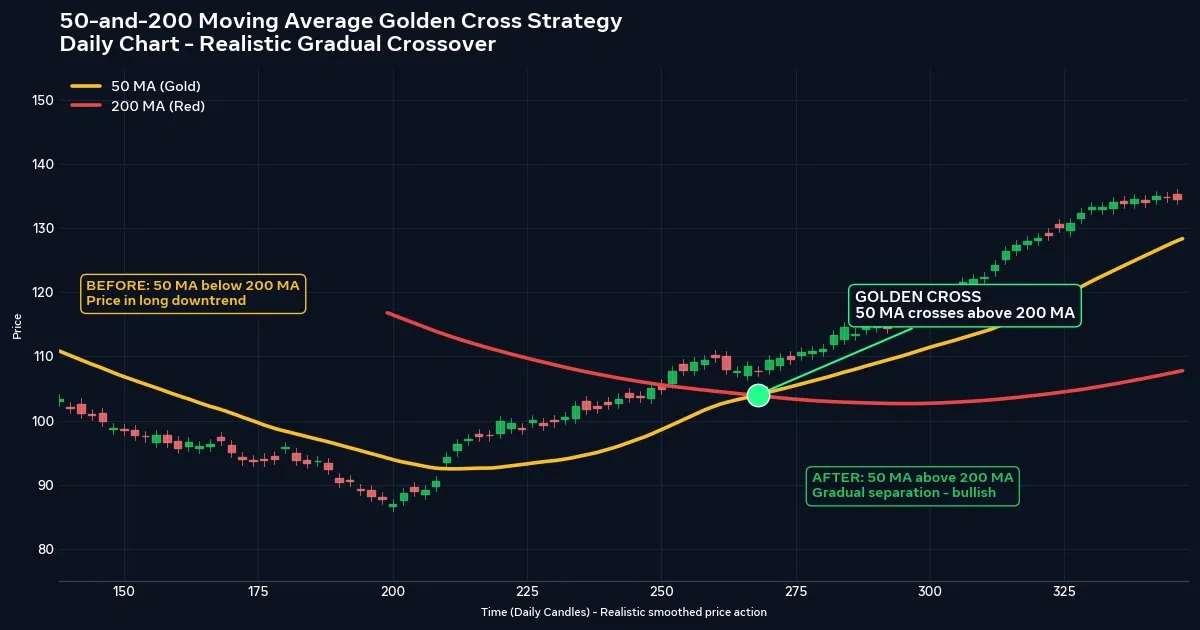
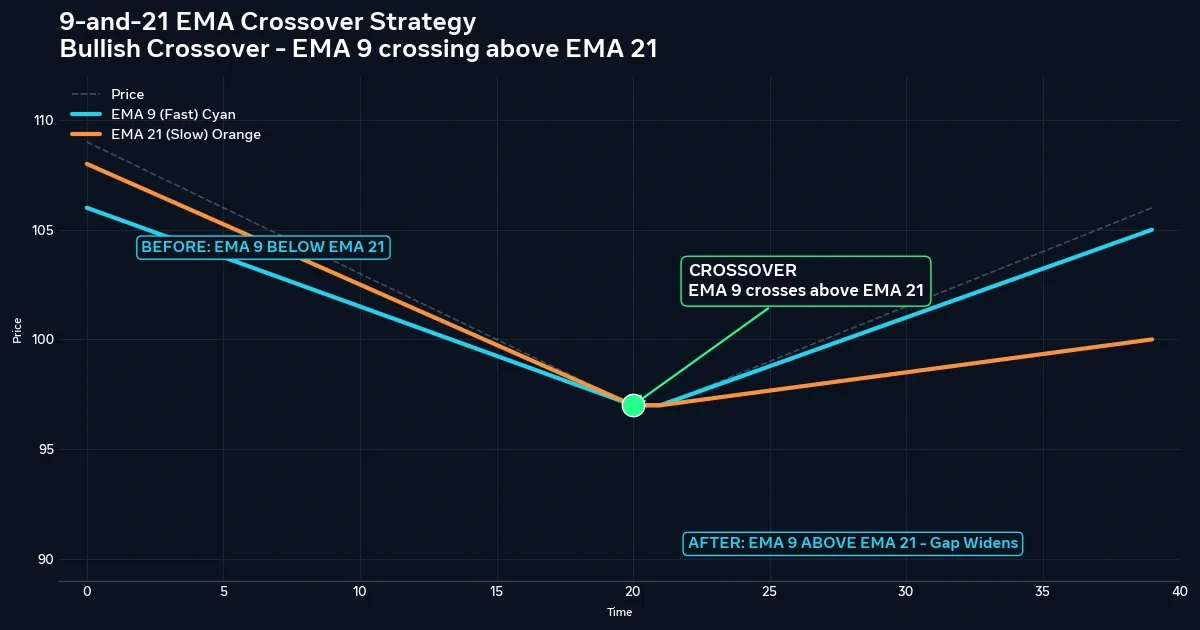
That’s a preference, not a proven advantage. Plenty of traders combine both, and the two approaches overlap more than the marketing suggests. If you’re deciding where to start, price action vs indicators compares them side by side.
Reading Direction From Highs and Lows
The simplest structure read works like this:
| Pattern of swings | Common reading | What a trader might wait for |
|---|---|---|
| Higher highs and higher lows | Uptrend | Pullbacks toward a prior low or zone |
| Lower highs and lower lows | Downtrend | Rallies toward a prior high or zone |
| Highs and lows stuck between two levels | Range | Reactions at the edges |
| A swing low is broken in an uptrend | Possible weakening | Confirmation before assuming a reversal |
The word “possible” matters. A broken swing is a warning that the old read is under pressure, not a prediction that the trend has ended.
Three Entry Styles Beginners Meet First
Entries vary widely among price action traders. These three show up most often in beginner material.
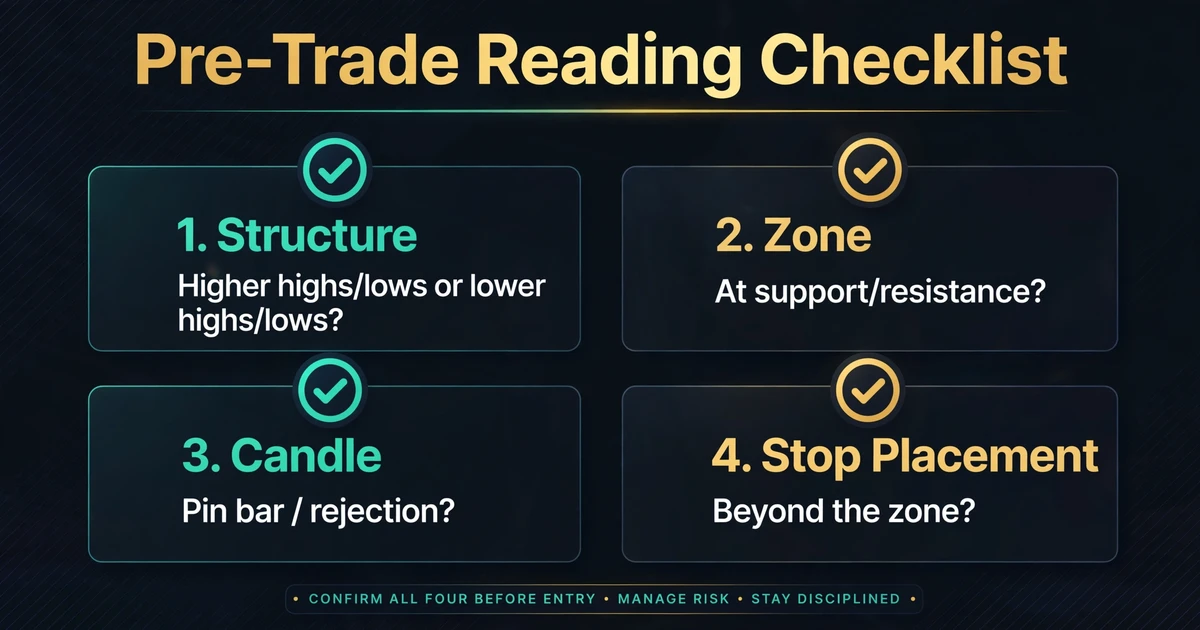
Rejection at a zone. Price reaches a marked zone and prints a candle with a long wick pointing into it (a pin bar). The wick shows price was pushed back. Traders often wait for the candle to close before acting, because an unfinished candle can change shape.
Break and retest. Price closes beyond a level, comes back to touch it from the other side, and holds. The old resistance behaves as new support, or the reverse. The retest gives a closer stop-loss than chasing the breakout, but price sometimes never comes back.
Engulfing candle after a pullback. In a trend, price pulls back, then a candle’s body covers the previous candle’s body in the trend’s direction. Candle shapes only mean something in context, which is the theme of advanced candlestick patterns.
A Support Bounce on AUD/USD: Hypothetical Numbers
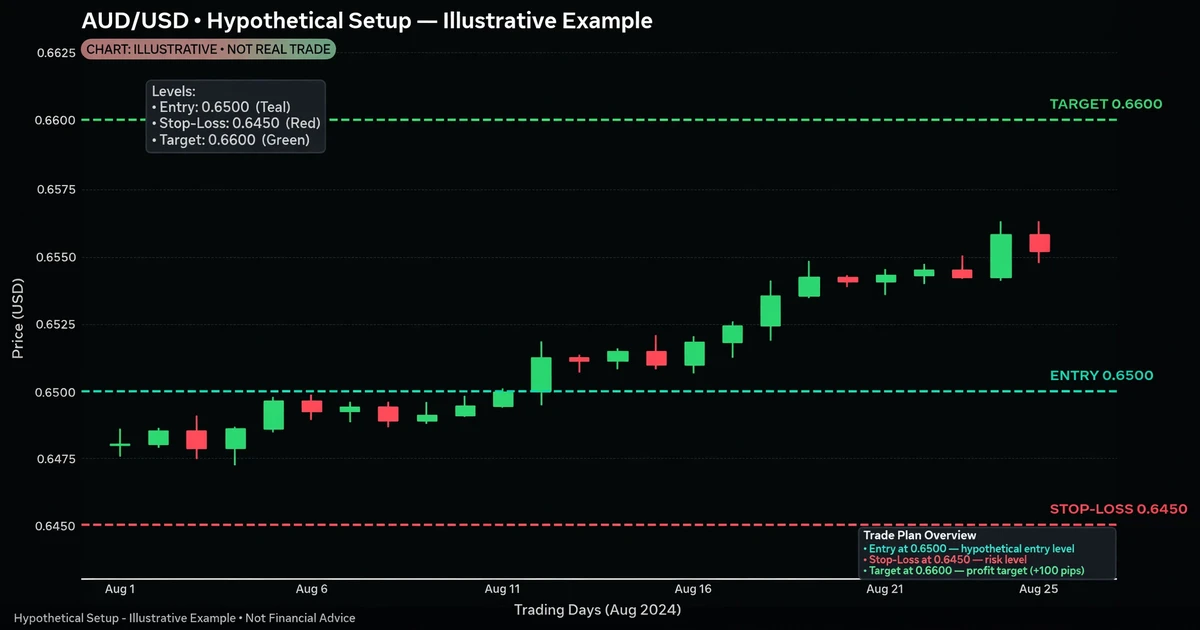
This is a hypothetical example for illustration only. It isn’t a real trade or a recommendation.
Suppose a 4-hour AUD/USD chart shows a support zone around 0.6560–0.6575 that held twice before. Price drifts back into it and prints a bullish pin bar with a long lower wick, closing at 0.6590. A trader waits for a later candle to trade above the pin bar’s high at 0.6595.
| Item | Level | Reasoning |
|---|---|---|
| Entry (buy) | 0.6595 | Above the rejection candle’s high |
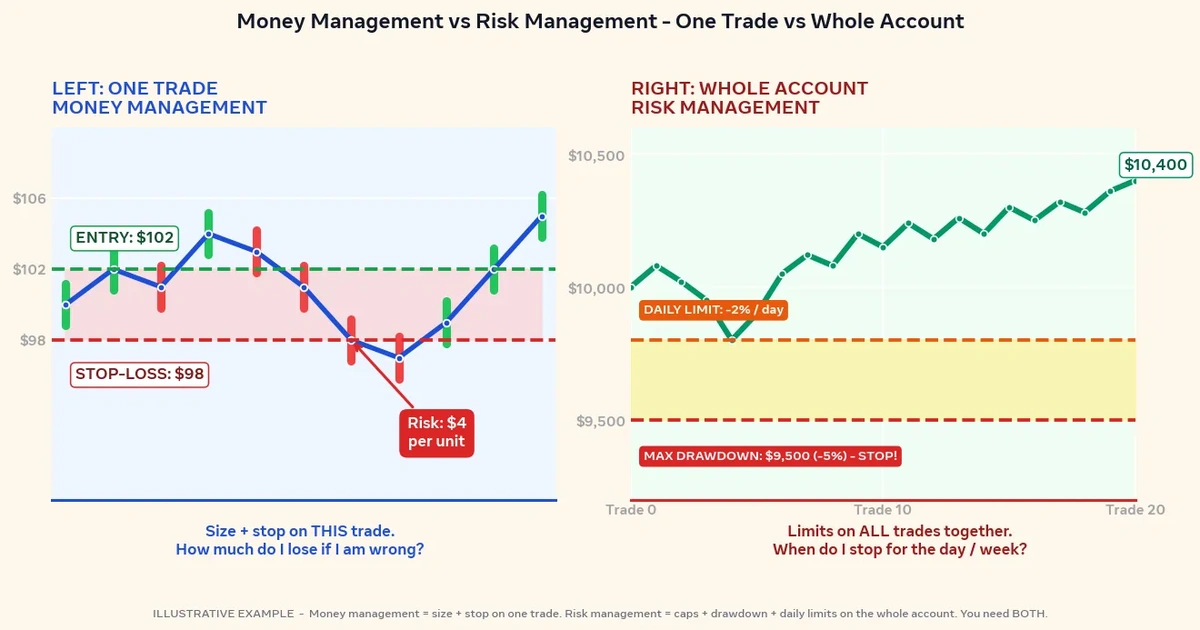
| Stop-loss | 0.6560 | Below the zone’s lower edge; the idea is wrong if price falls through |
| Target | 0.6665 | The prior swing high |
| Risk distance | 35 pips | 0.6595 − 0.6560 |
| Reward distance | 70 pips | 0.6665 − 0.6595 |
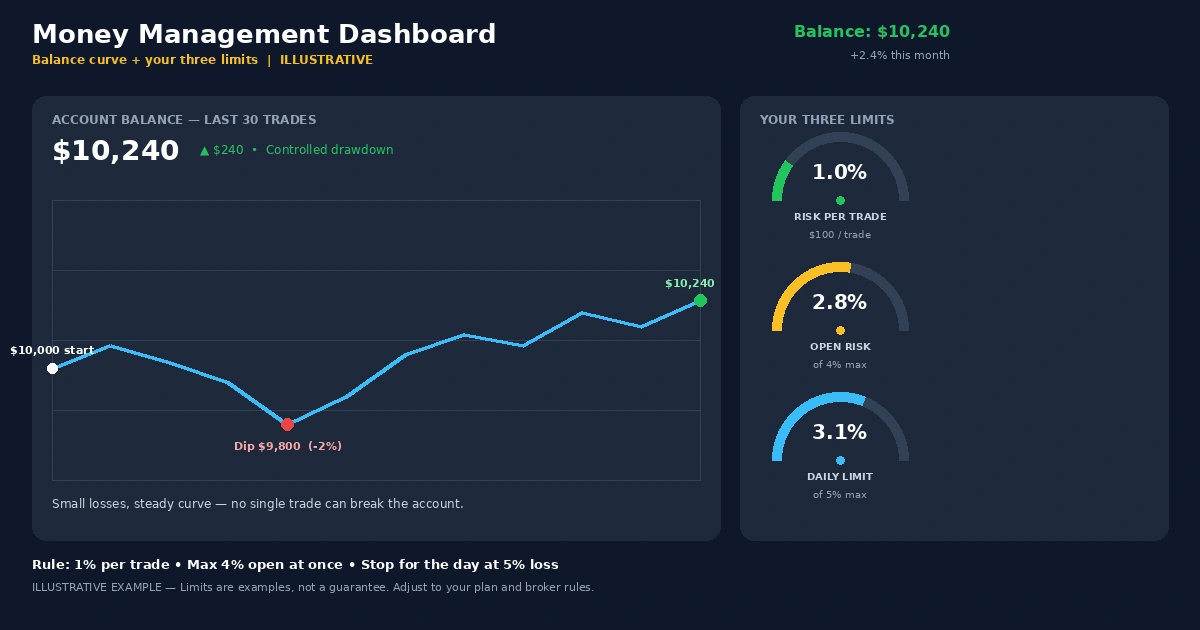
A pip is the standard small price unit; for AUD/USD it’s 0.0001. Assume a $2,500 account risking 1% ($25) and a pip value of roughly $0.10 per micro lot (a micro lot is 1,000 units of currency).
- Position size: $25 ÷ (35 pips × $0.10) ≈ 7 micro lots
- Risk if stopped: 7 × 35 × $0.10 = $24.50
- Reward if the target is hit: 7 × 70 × $0.10 = $49.00
- Reward-to-risk: 2:1
The example ignores spread (the gap between buy and sell prices), commission, and slippage (getting filled at a worse price than planned). Real costs shrink the reward and can push the loss past $24.50. Price may also stop out the trade and then reach the target anyway. A stop-loss limits risk; it doesn’t remove it.
Five Habits That Muddy a Beginner’s Read
- Drawing too many zones. A chart covered in horizontal bands makes every candle look like it’s reacting to something. Keep only the levels that stand out on a higher timeframe.
- Acting on unfinished candles. A pin bar at 2:30 can look like a full-body candle by 3:00. Wait for the close.
- Ignoring the larger trend. A bullish pin bar inside a steep downtrend on the daily chart is a weaker clue than the same candle in an uptrend.
- Hunting for patterns after the fact. Looking back at a finished chart makes every turn look obvious. Practice on charts you scroll forward one candle at a time.
- Moving stops to avoid a loss. If the stop was placed where the idea fails, widening it after entry turns a planned loss into an open-ended one.
Why Bare-Chart Trades Lose: Subjectivity, Chop, and Spikes
- Subjectivity. Where one trader sees a zone, another sees noise. Without written rules, you can’t tell whether a result came from the method or from mood.
- Choppy markets. In tight, directionless ranges, rejection candles appear constantly and follow-through is rare. Many small stops add up.
- News spikes. Economic releases can slice through zones in seconds. A neat setup doesn’t protect against a gap or a fast move, and the fill can land beyond your stop.
- Leverage. Leverage means controlling a larger position than your deposit. It magnifies gains and losses alike, and you can lose some or all of your capital.
- Demo-to-live gap. Executing calmly on a demo account is easier than doing it with real money at stake. Results in practice often differ from results in live trading.
Treat the 2:1 ratio in the example as arithmetic, not an expectation. No setup wins every time, and any win rate you read elsewhere should be questioned.
When Price Action Is a Poor Fit
This approach may frustrate you if you want mechanical rules with no judgment, can’t watch charts at the times your setups form, or tend to override your own plan after a few losses. It also takes screen time to build pattern recognition. If you prefer fully rule-based systems, indicator-driven methods or automation may suit you better, though they carry their own limits.
Questions New Price Action Traders Ask Before Their First Setup
Is price action trading better than using indicators?
Neither is better by default. Price action reads raw movement, while indicators summarize it with calculations that lag. Many traders use a mix, such as a moving average for direction and a zone for entries. Pick whichever you can apply consistently and test on a demo account.
Do I need to memorize candlestick patterns?
No. A few well-understood candles (pin bar, engulfing, inside bar) in the right context are enough to start. The location of the candle, such as at a zone or in a trend, usually matters more than its name.
What timeframe works best for price action?
There’s no single answer. Higher timeframes like the 4-hour and daily have fewer, cleaner signals and less noise. Lower timeframes give more setups but more false ones. Beginners often learn structure on higher timeframes first.
Can price action trading work in forex, gold, and stocks?
The method reads price behavior, so traders apply it across many markets. Each market has its own volatility, spreads, and trading hours, which change how stops and targets should be set. Test on the instrument you plan to trade.
How long does it take to learn?
It varies by person. Learning the vocabulary takes days; developing a reliable read of charts usually takes months of deliberate practice and review. Keeping a journal of each setup, including the losers, speeds up the process.
Practice Reading Before You Practice Trading
Price action trading is a way of reading charts, and the skill comes before any strategy. Before risking anything, scroll back on one chart and mark swing highs and lows, two or three zones, and the rejection candles near them, then check whether your marks would have made sense in real time. For a next read, compare the approach with the indicator-based alternative in price action vs indicators and note which one feels clearer to you.
Disclaimer
This article is for educational purposes only and is not financial advice. Forex and CFD trading involves a high level of risk, and you can lose some or all of your capital. Leverage can magnify both gains and losses. Never trade with money you can’t afford to lose.
This is a trading framework, not a guarantee. No strategy wins every trade, and results vary with market conditions, execution, and risk management.
Any percentages or figures shown are historical averages or hypothetical examples, not guarantees. Past performance does not predict future results.
Join now
Comments (0)
Be the first to comment.