
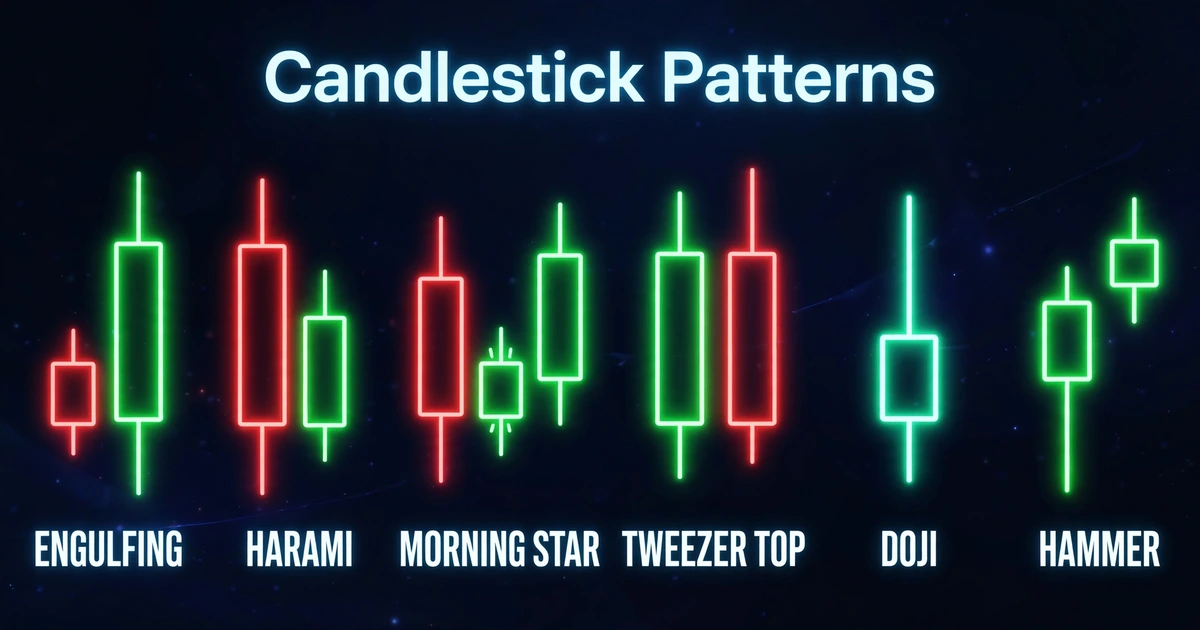
Advanced Candlestick Patterns: Beyond Doji and Hammer
A trader spots a textbook bullish engulfing candle on the 15-minute chart, buys the next open, and watches price fall through the pattern’s low before lunch. The pattern was real. The trade was still a poor one. Most advanced candlestick patterns fail for the same reason: the shape gets traded and the surroundings get ignored.
This guide covers the two- and three-candle patterns that go beyond doji and hammer, what each one says about buyers and sellers, and how to filter them so you’re not trading shapes in the middle of nowhere.
Quick Answer
- Advanced candlestick patterns combine two or more candles to show a shift in control between buyers and sellers, such as engulfing, harami, piercing line, morning/evening star, tweezer tops/bottoms and three-candle continuation setups.
- The pattern matters less than where it forms. A reversal pattern at a tested level in a clear trend carries more weight than the same pattern in the middle of a range.
- Treat every pattern as a prompt to look closer, not an entry order. Confirmation, a stop-loss and a fixed risk amount come first.
- No pattern wins every time, and published “success rates” vary widely depending on how the pattern was defined and tested.
Why Single-Candle Patterns Leave Gaps
A doji says the market hesitated. A hammer says sellers pushed price down and buyers pushed it back. Both are useful, but each is one candle, so each carries a thin slice of information.
Multi-candle patterns add sequence. You can see who was in control on the first candle, how the second candle responded, and sometimes how a third candle either confirmed or rejected the move.
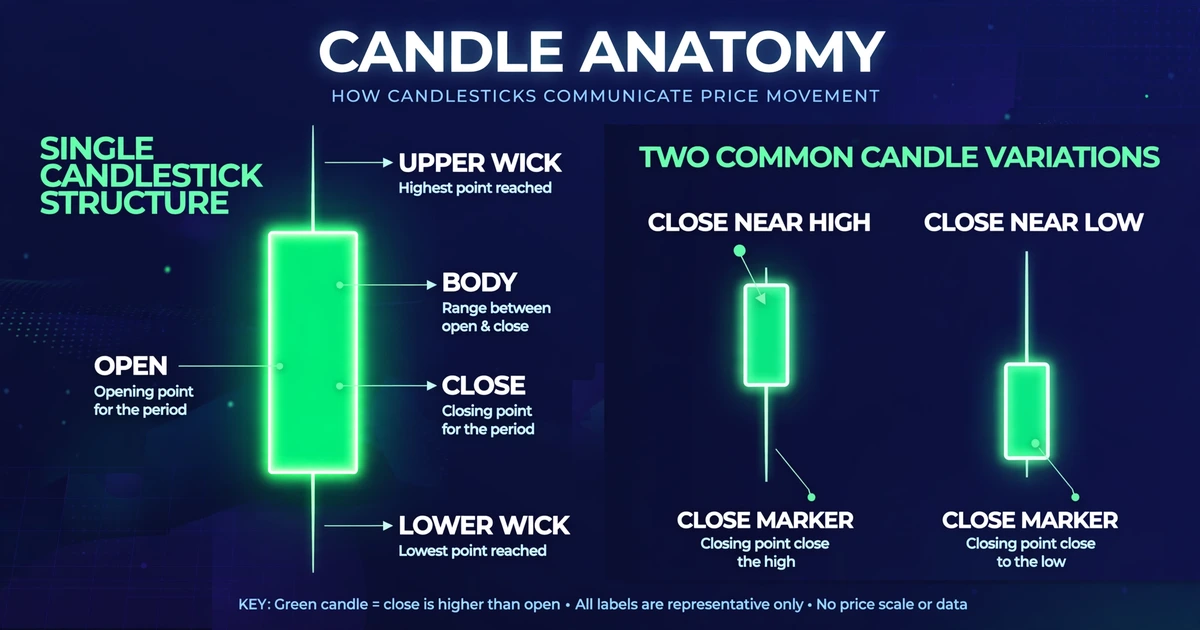
Before reading any pattern, check three things on every candle:
- Body: the distance between the open and close. A large body means one side dominated that period.
- Wicks (shadows): the thin lines above and below the body. Long wicks show price was pushed to a level and rejected.
- Close location: where the candle closed within its range. A close near the high shows buyers finished in control. A close near the low shows the opposite.
Nearly every pattern below is just these three readings stacked in a specific order.
Two-Candle Reversal Patterns
Engulfing patterns
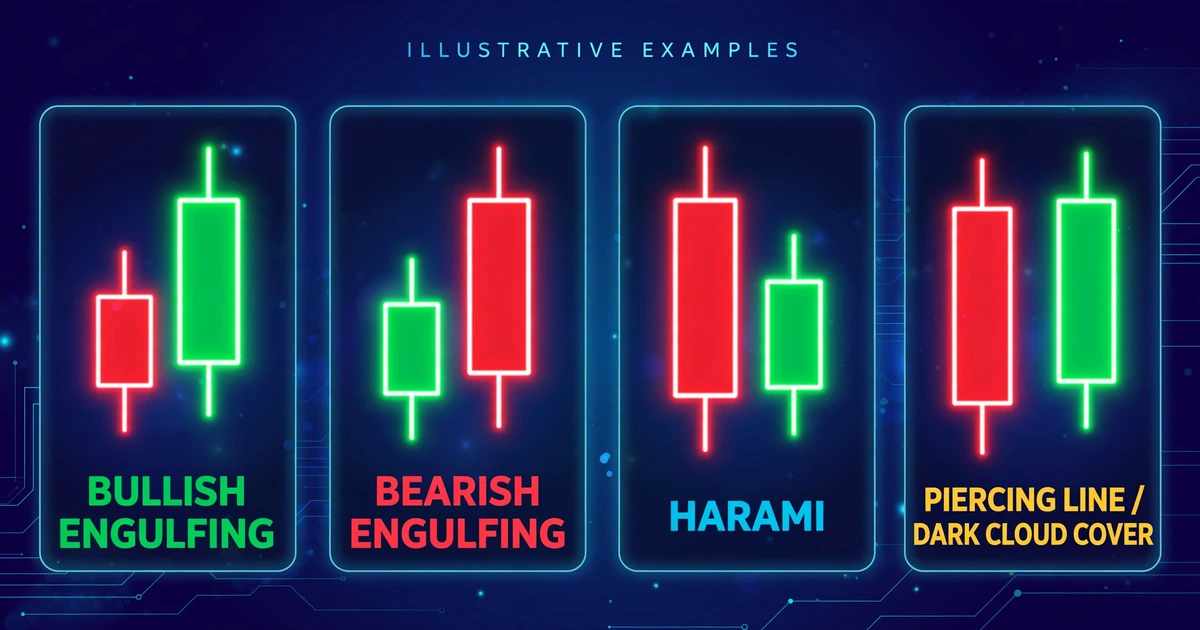
A bullish engulfing pattern forms when a bearish candle is followed by a bullish candle whose body completely covers the previous candle’s body. A bearish engulfing is the mirror image after an advance.
The logic: sellers controlled the first candle, then buyers not only took back all of it but closed above where the sellers started. Many traders look for the engulfing body to be noticeably larger than recent candles, since a slightly bigger candle in a quiet market says little.
Only the bodies need to be engulfed. Wicks can poke outside, and traders define this slightly differently, so decide on your rule and stick to it when you review charts.
Harami (inside-body) patterns
Harami is the opposite of engulfing. A large candle is followed by a small candle whose body sits entirely inside the first candle’s body.
It signals a loss of momentum, not a reversal. After a strong bearish candle, a small inside candle says sellers couldn’t follow through, but buyers haven’t taken over either. That’s why many traders treat a harami as a warning to tighten expectations and wait for the next candle.
Piercing line and dark cloud cover
These two sit between engulfing and harami in strength.
- Piercing line: after a bearish candle, a bullish candle opens lower but closes above the midpoint of the previous body, without fully engulfing it.
- Dark cloud cover: after a bullish candle, a bearish candle opens higher but closes below the midpoint of the previous body.
Because forex trades nearly around the clock, a true “gap” at the open is rare on intraday charts. Most traders judge these patterns by where the second candle closes relative to the midpoint, not by a gap that may never appear.
Tweezer tops and bottoms
A tweezer top is two adjacent candles with nearly identical highs, usually after an advance. A tweezer bottom is two candles with nearly identical lows after a decline.
The message is simple: price tested the same level twice in a row and was rejected both times. Tweezers are most convincing when that shared level is also a known support or resistance area.
Three-Candle Patterns
Morning star and evening star
A morning star has three parts: a large bearish candle, a small-bodied candle (any color) that shows hesitation, then a large bullish candle that closes well into the first candle’s body. The evening star is the reverse after an uptrend.
The middle candle is the important one. It marks the moment the prior move ran out of energy. The third candle then shows the opposing side taking over.
Three inside up and three inside down
This pattern is a harami with confirmation. After the small inside candle, a third candle closes beyond the first candle’s body in the opposite direction. Waiting for that third candle costs you some entry price, but it filters out many harami patterns that simply fizzle.
Three white soldiers and three black crows
Three consecutive long bullish candles, each opening within the previous body and closing near its high, form three white soldiers. Three long bearish candles with the same behavior form three black crows.
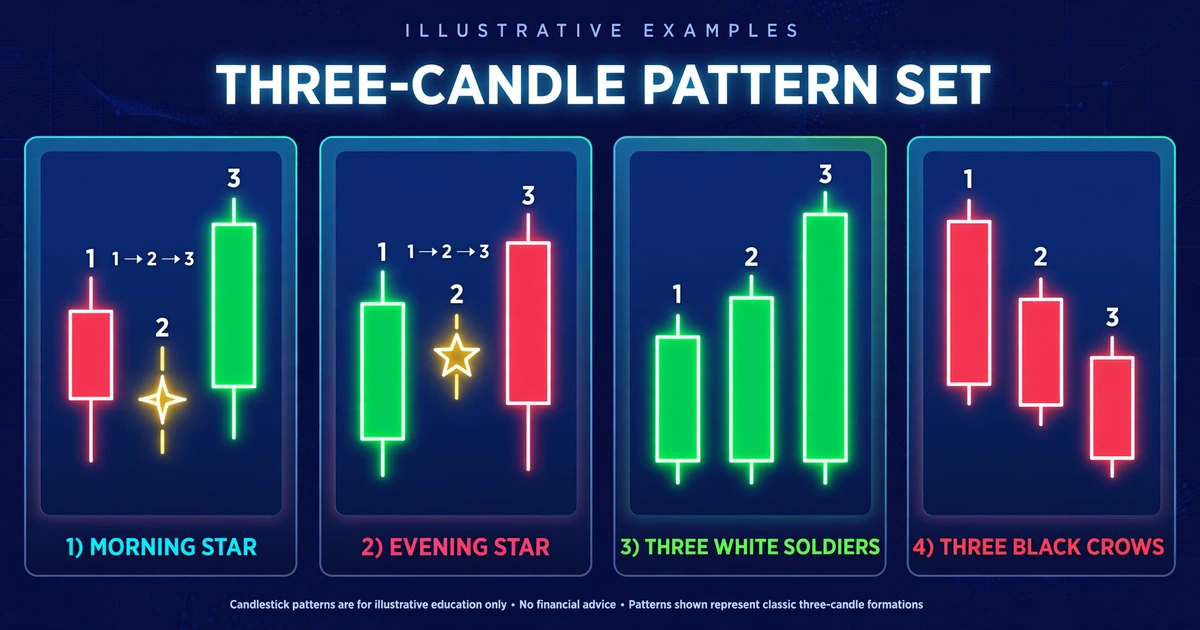
These are momentum patterns. The trap is that by the time all three candles print, a large part of the move may already be behind you. They’re often more useful as evidence that a trend has started than as a place to enter.
Continuation and Indecision Patterns
Not every pattern calls a turning point. Some say the current trend is taking a breath.
- Marubozu: a candle with a full body and little or no wick. A bullish marubozu means buyers held control from open to close. It can mark strong momentum, or an exhaustion move if it appears late in a long run.
- Inside bar: a candle whose entire range (wicks included) sits inside the previous candle’s range. It shows compression. Traders watch for a break of either side of the larger “mother” candle.
- Rising three methods / falling three methods: a long trend candle, then a small pullback of three or so candles that stays inside the first candle’s range, then another long candle in the trend’s direction. It describes a pause that didn’t break the trend.
Pattern Reference Table
| Pattern | Candles | What it suggests | What weakens it |
|---|---|---|---|
| Engulfing | 2 | Control flipped | Small engulfing body, or forms mid-range |
| Harami | 2 | Momentum fading | No follow-through candle |
| Piercing / dark cloud | 2 | Partial reversal | Closes below/above the midpoint |
| Tweezer top/bottom | 2 | Level rejected twice | Level isn’t significant |
| Morning/evening star | 3 | Turn after hesitation | Third candle stalls |
| Three inside up/down | 3 | Confirmed harami | Third candle is weak |
| Three soldiers/crows | 3 | Strong momentum | Appears after an already extended move |
| Marubozu | 1 | One side dominated | Late in an extended trend |
| Inside bar | 2+ | Compression | Breakout reverses quickly |
| Rising/falling three methods | 5 | Trend pause | Pullback candles break the first candle’s range |
Context Matters More Than Shape
Two identical engulfing candles can mean opposite things depending on where they appear. Three filters help separate meaningful patterns from noise.
1. Location. A reversal pattern at a level where price has reacted before is worth a closer look. The same pattern floating between levels is mostly decoration. If you’re unsure how to judge a level, a breakdown of strong vs weak support and resistance zones covers what makes one level more significant than another.
2. Trend direction. A bullish reversal after a long decline has a clearer story than a bullish pattern inside a strong downtrend that’s still making lower highs. Drawing the trend properly first helps, and the guide on how to draw trendlines correctly is a good companion.
3. Candle size relative to recent ranges. A pattern built from candles much smaller than the recent average often reflects thin trading, not conviction.
This is the same thinking behind price action trading, where candles are read in the context of structure rather than in isolation.
One practical note on timeframes: higher timeframes (4-hour, daily) tend to produce fewer but cleaner patterns, while 1- and 5-minute charts print many that are mostly noise. A daily candle’s close also depends on your broker’s server time. Many brokers close the daily candle at 5 p.m. New York time, which shifts relative to GMT/UTC when daylight saving changes. Check yours so you’re not misreading unfinished candles.
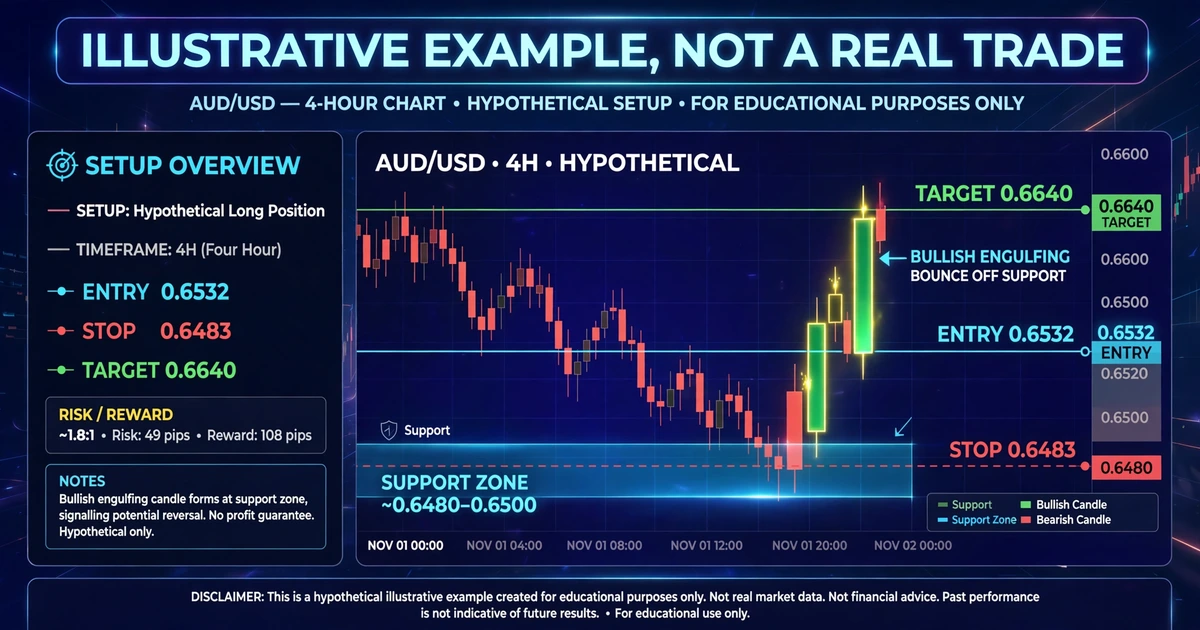
Worked Example: Bullish Engulfing at Support
This is a hypothetical example for illustration only, not a real trade or a current market view.
Assumptions:
- Pair: AUD/USD, 4-hour chart, USD-denominated account of $5,000
- Support zone near 0.6500 has held on several earlier tests
- Price falls into the zone, then a bearish candle is followed by a bullish engulfing candle with a low of 0.6488 and a high of 0.6530
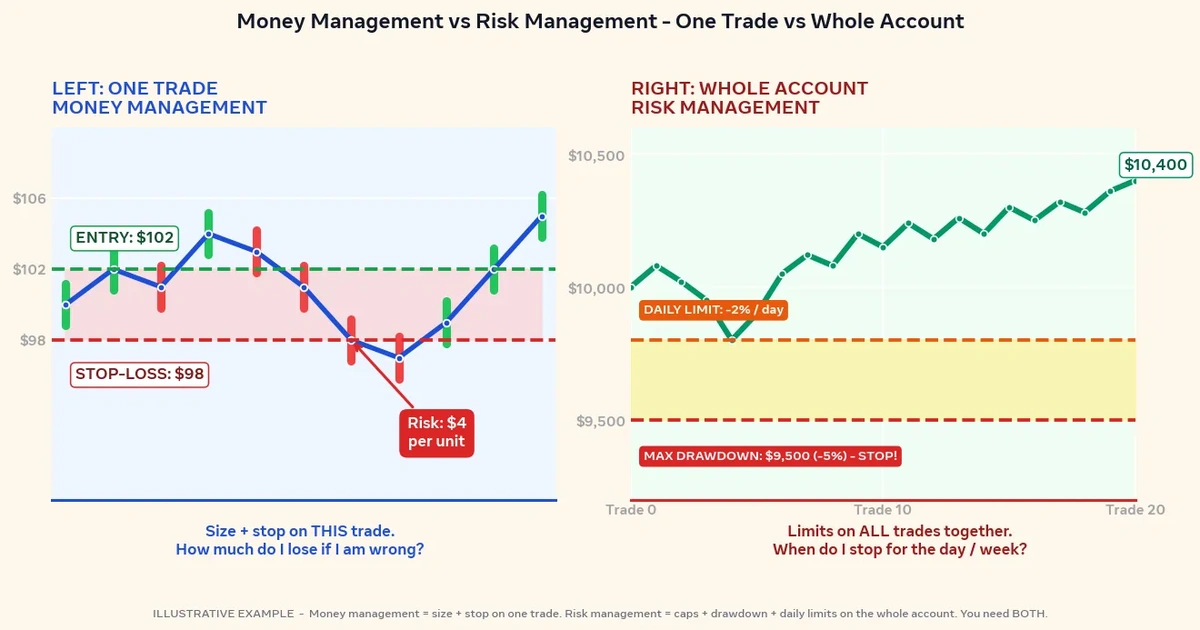
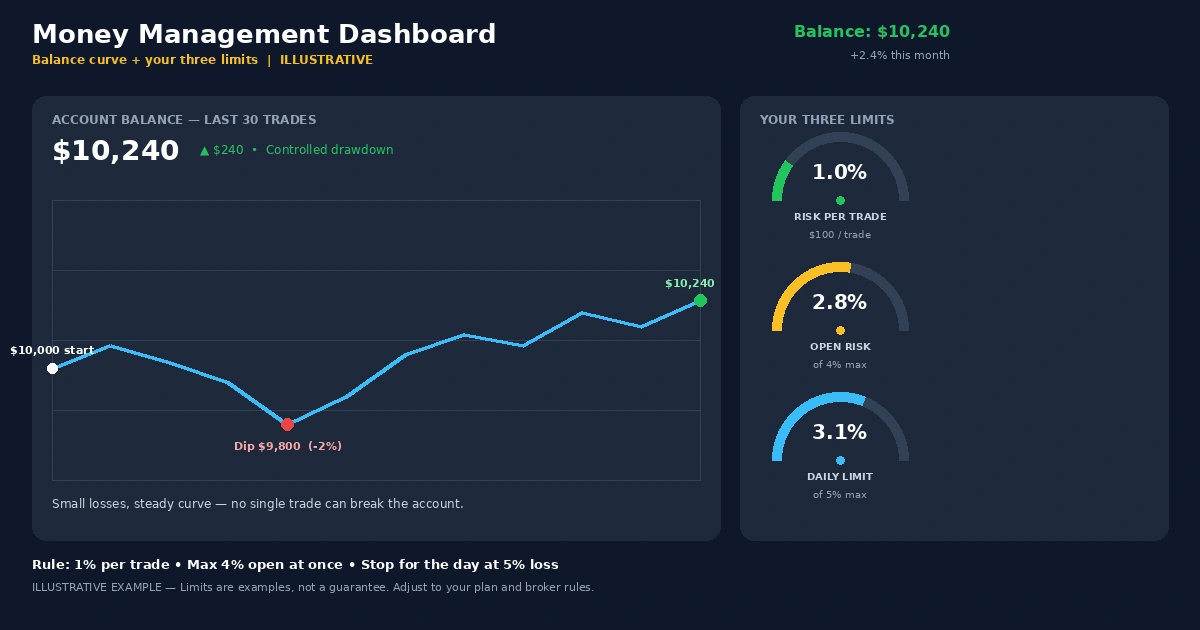
- Risk per trade: 1% of the account = $50 (a fixed percentage many traders use; the right level depends on your situation)
Step 1: Entry. Place a buy-stop 2 pips above the engulfing high: 0.6530 + 0.0002 = 0.6532. This waits for the next candle to confirm by trading above the pattern.
Step 2: Stop-loss. Place it 5 pips below the pattern’s low: 0.6488 − 0.0005 = 0.6483.
Step 3: Risk in pips. 0.6532 − 0.6483 = 0.0049 = 49 pips.
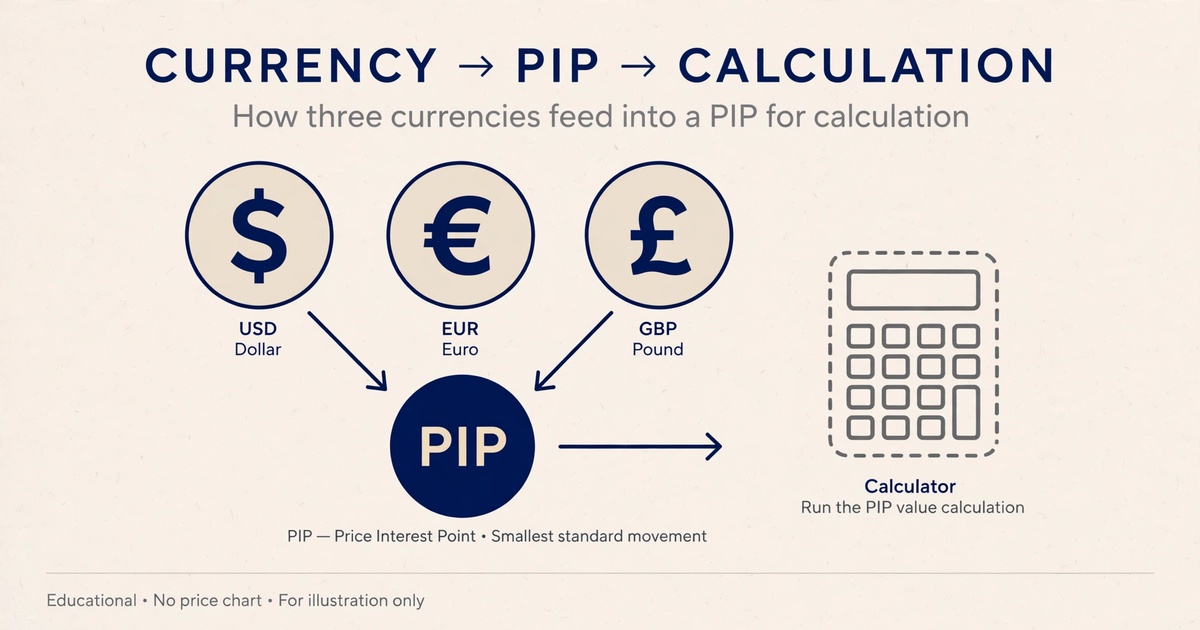
Step 4: Position size. On AUD/USD with a USD account, one pip is about $10 per standard lot, or $0.10 per micro lot (1,000 units).
$50 ÷ (49 pips × $0.10) = 10.2, rounded down to 10 micro lots.
Actual risk: 10 × 49 × $0.10 = $49.
Step 5: Target logic. Suppose the next resistance sits at 0.6640. That’s 0.6640 − 0.6532 = 0.0108 = 108 pips, or about 2.2 times the risk. If the nearest resistance were only 40 pips away, the setup wouldn’t justify the 49-pip stop.
Step 6: What invalidates it. A close below 0.6483, or a wide-spread, low-liquidity period where slippage could push the stop fill well past your level. Spread, commission and slippage all reduce the real reward and can increase the real loss, and they vary by broker and time of day.
Notice how much of this is decided before the pattern matters: the level, the size, the stop and the reward distance.
How to Test a Pattern Before You Trust It
Pick one pattern and one pair and timeframe. Scroll back through charts and mark every instance, including the ones that failed. Don’t skip the ugly ones.
For each, record the location (at a level or not), the trend, what happened over the next several candles, and where your stop would have been. A few dozen examples will show you more than any article, including this one.
Then repeat on a demo account in real time, because looking at a finished chart is very different from deciding with the right edge still moving. Backtested or hand-marked results can look better than live trading because hindsight makes it easy to see “obvious” patterns that weren’t obvious in the moment.
Mistakes That Cost Traders Most With Candle Patterns
- Treating pattern names as entry orders. The name describes what happened. It doesn’t tell you what’s next.
- Entering on the pattern candle before it closes. An engulfing candle that’s mid-formation can reverse into something completely different by the close.
- Counting small, cramped candles as patterns. If the “engulfing” body is a few pips in a quiet session, it carries little information.
- Memorizing 40 patterns. Knowing five or six well, with clear rules, beats a long mental catalog you can’t apply consistently.
- Ignoring the stop. Many patterns have a natural invalidation point (the pattern’s extreme). If your stop would need to be far wider than the pattern’s range, the setup may not fit your risk limit.
- Ignoring news. A scheduled high-impact release can overwhelm any pattern within seconds.
Risks and Limitations
Candlestick patterns are descriptive, not predictive. They show what price did, and traders infer what might follow. That inference fails often.
- Subjectivity: Definitions differ between books and traders. Whether a candle “engulfs” or “pierces” can depend on small measurements, which makes consistent testing harder.
- Mixed evidence: Studies and trader tests of candlestick patterns have produced mixed results depending on the market, timeframe and rules. No pattern has a guaranteed hit rate.
- False signals in choppy markets: In ranging conditions, reversal patterns appear frequently and fail frequently.
- Late entries: Waiting for confirmation improves quality but usually worsens your entry price, which shrinks reward relative to risk.
- Leverage: Leverage magnifies losses as well as gains. A stop that’s too tight for a volatile pair gets hit by normal movement, while a stop that’s too wide with an oversized position can cause losses larger than you planned. In some cases you can lose the entire amount you deposited.
- Execution costs: Spreads widen around news and at rollover, and stop orders can fill at worse prices (slippage) in fast markets.
- Psychological pressure: After a few failed patterns, traders tend to skip valid setups or take low-quality ones to “make it back.”
Frequently Asked Questions
What is the most reliable candlestick pattern?
No pattern is reliable on its own. Engulfing and morning/evening star patterns are widely followed, but their usefulness depends on location, trend and risk management. Test any pattern on your pair and timeframe, and don’t rely on someone else’s claimed success rate.
Is a doji a reversal or continuation pattern?
A doji shows indecision, which can precede either. After a long move at a key level, traders often treat it as a warning of a pause or reversal. In the middle of a trend, it may simply be a rest. The next candle usually tells you more.
How many candles do I need for a pattern?
It varies: one (hammer, marubozu), two (engulfing, harami, tweezers), three (stars, three soldiers), or five (rising/falling three methods). More candles add context but also arrive later, so you often trade a smaller portion of the move.
Do candlestick patterns work on all timeframes?
They appear on every timeframe, but they’re generally less noisy on higher ones such as the 4-hour and daily charts. On very short timeframes, spreads and random movement can swamp the pattern’s meaning. Test your chosen timeframe before committing real money.
Should I use candlestick patterns with indicators?
Many traders pair patterns with a trend filter, such as a moving average, or with momentum tools like RSI to check context. It’s optional. What matters is that your rules are written down, specific and tested before you risk capital.
What’s the difference between candlestick patterns and chart patterns?
Candlestick patterns span one to a few candles and describe short-term shifts. Chart patterns, such as triangles and head and shoulders, develop across many candles and describe larger structures. Traders often use both together.
Reading Candles Before Naming Them
If you take one thing from this guide, make it this: describe what each candle shows (body, wicks, close) before you reach for a pattern name. The name is shorthand, and shorthand misleads when the context is wrong.
For your next step, pick a single pattern, mark 20 past examples on one chart and note which ones formed at a meaningful level. Then see how chart patterns are traded as the larger-scale version of the same idea.
Disclaimer
This article is for educational purposes only and is not financial advice. Forex and CFD trading involves a high level of risk, and you can lose some or all of your capital. Leverage can magnify both gains and losses. Never trade with money you can’t afford to lose.
This is a trading framework, not a guarantee. No strategy wins every trade, and results vary with market conditions, execution, and risk management.
Join now
Comments (0)
Be the first to comment.