
Price Action vs Indicators: Which Approach Is Better?
Two traders can look at the same pair at the same moment and disagree completely. One has six indicators stacked on the chart. The other has bare candles and a few horizontal lines. Both are usually convinced they have the better setup. The price action vs indicators debate lasts because each side describes something real: one reads what price just did, the other reads a calculation built from it. Neither predicts the future. The sections below sort out what each approach offers, where each one fails, and how to test the difference on your own charts.
Neither Wins Outright, but They Do Different Jobs
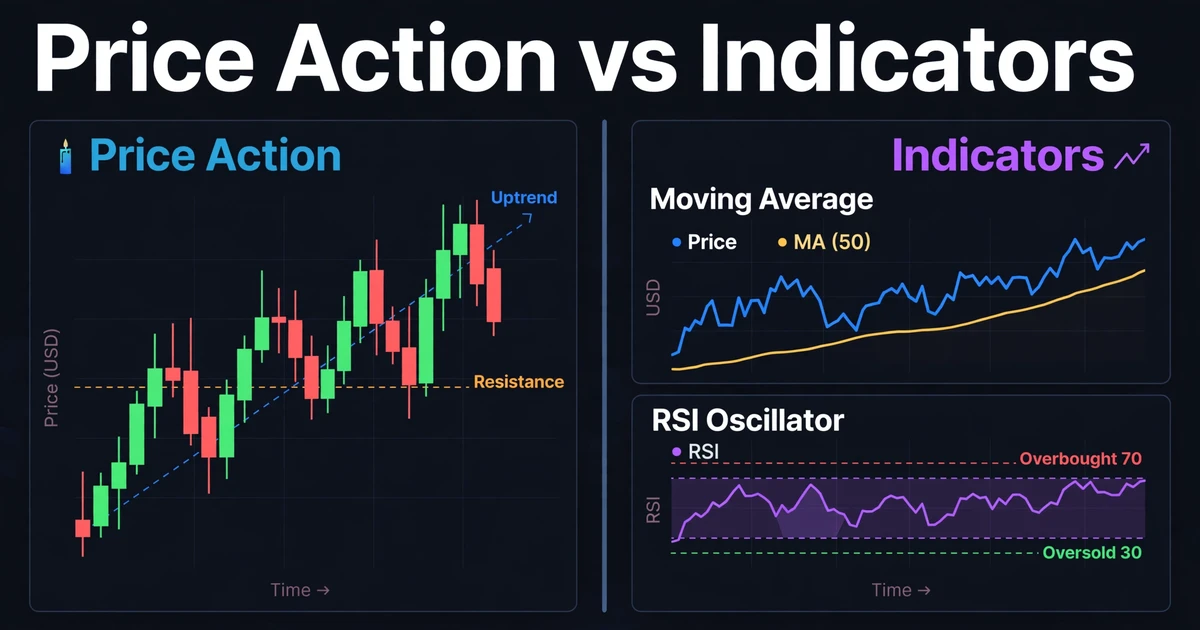
- Price action means trading from candles, swing highs and lows, and support and resistance, with no calculated overlays doing the thinking.
- Indicators are formulas applied to price. They add consistency and a trend or momentum read, but they trail the market and contain no information that price hasn’t already produced.
- Price action reacts faster and demands more judgment. Indicators are easier to write into fixed rules but respond more slowly.
- Many traders use price for location and timing, then add one or two indicators as a check on trend or momentum.
Candles and Swings Versus Formulas Built on Them
Price action traders work from the raw record of the market: each candle’s open, high, low, and close, plus the swing highs and lows those candles form. From that record they read trend structure (higher highs and higher lows in an uptrend), mark support and resistance, and watch how candles behave at those levels. If you want the foundation, our primer on price action trading covers it step by step.
Indicators start from the same raw record and run it through a formula. A simple moving average adds the last 20 closing prices and divides by 20. The Relative Strength Index (RSI) compares average gains with average losses over a set window, usually 14 periods, and scales the result from 0 to 100. MACD subtracts one exponential moving average (an average that weights recent prices more heavily) from another to gauge shifts in momentum.
The consequence is easy to miss. Almost every popular indicator is a re-expression of the same open, high, low, and close, so it isn’t an independent source of information. Even volume indicators in spot forex rely on tick volume, which counts the price updates your platform receives rather than the amount actually traded. The market is decentralized, so there is no single exchange tape.
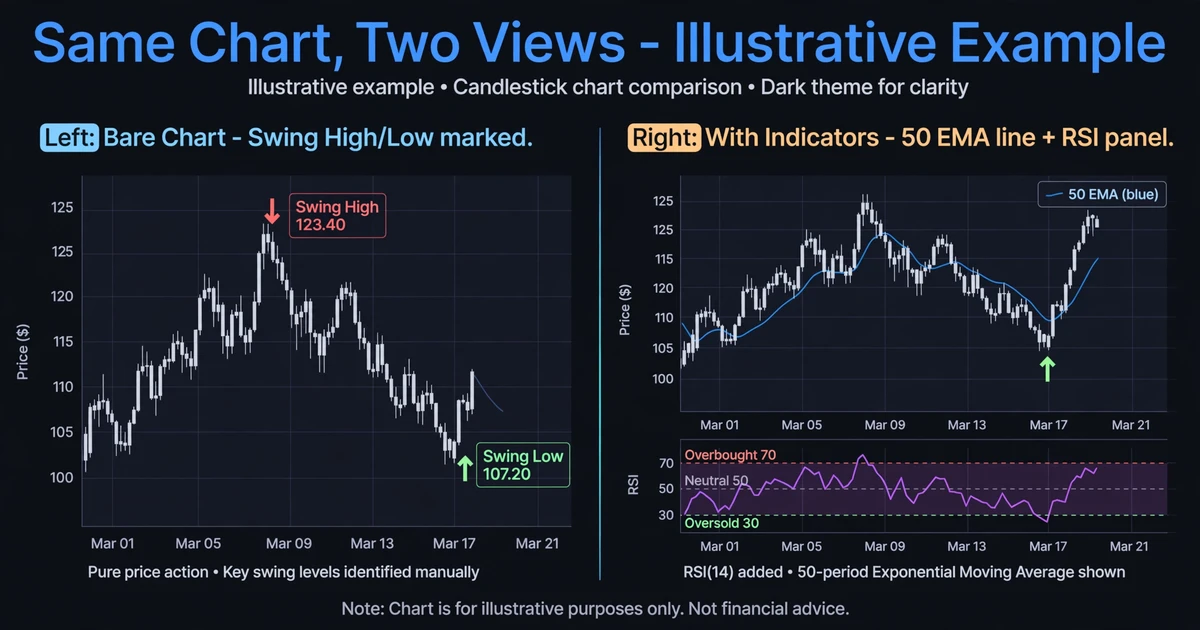
What indicators do add is a different view of the same data: smoothing, scaling, and fixed rules. A moving average strips out single-candle noise. RSI puts momentum on a bounded scale. Average True Range (ATR) measures typical candle size, which helps with stop placement. Those are real benefits, but they are a new view of old information.
The Lag Problem: Smoothing Costs You Speed
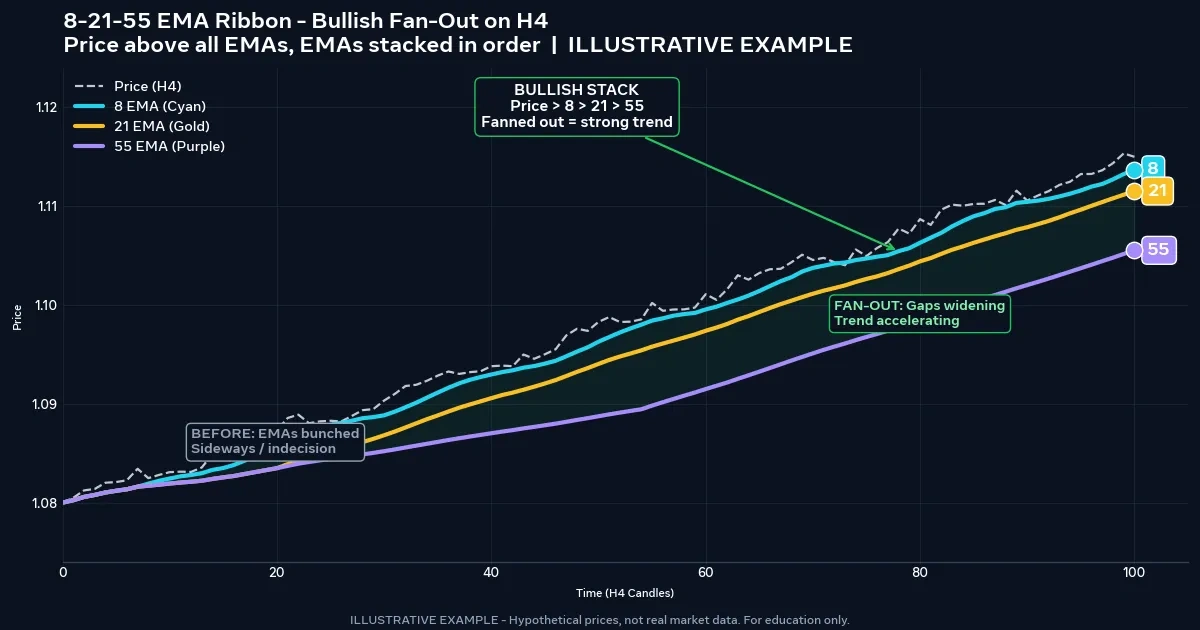
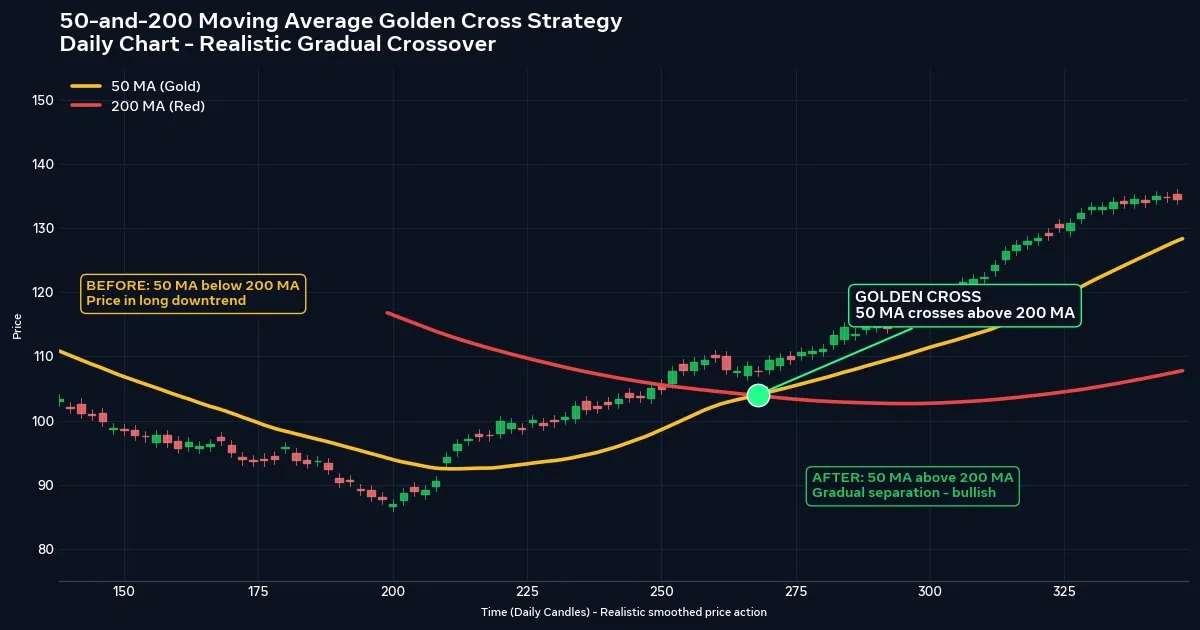
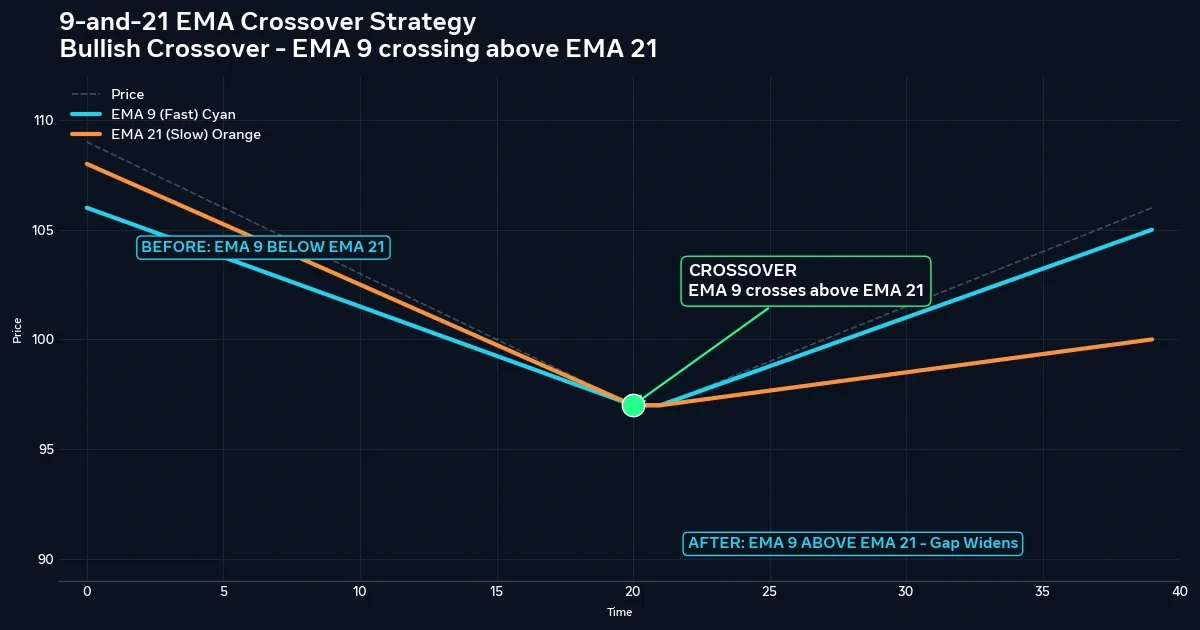
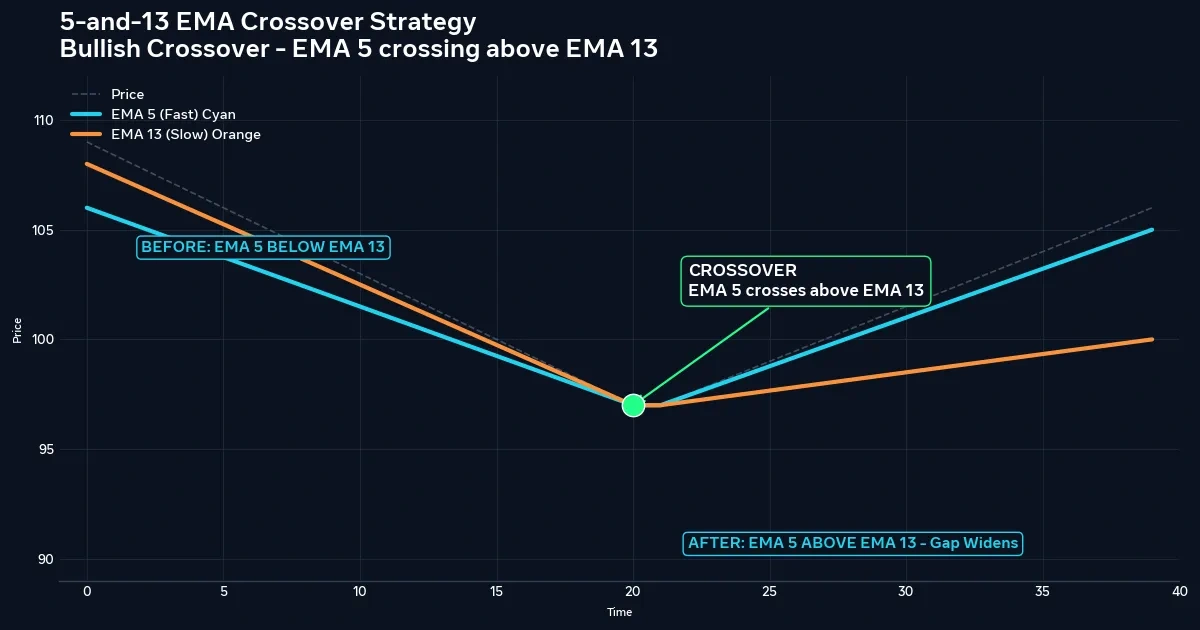
Lag is the most repeated criticism of indicators, and it’s a fair one. A 20-period moving average can’t turn upward until enough recent closes exceed older ones, so by the time the line bends, price has already moved. A 20 and 50 EMA crossover strategy signals only after the shorter average overtakes the longer one, which usually means the early part of the move is gone.
Lag also buys something. Smoothing is the reason a moving average ignores a one-candle spike. Shorten the settings and you get faster signals with more false ones. Lengthen them and you get fewer, later signals. That trade-off is built into the math, so no better setting will make it disappear.
Price action isn’t lag-free either. A bullish engulfing candle can only be confirmed once the candle closes, and a breakout is only confirmed after price has already broken. The difference is one of distance: price-based signals sit closer to the move, while indicator signals are one calculation step further away.
Price Action’s Strength Is Clarity, Its Weakness Is Judgment
A clean level on a bare chart can tell you more, faster, than any oscillator. You can see where price reversed before, how it behaved on the retest, and whether candles are closing with momentum or stalling. There’s no settings menu to adjust and no calculation window to fall out of sync with the market.
The cost is subjectivity. Ask two traders to mark support on the same chart and you’ll often get two different zones. Whether a wick counts, whether a swing is “major,” and whether a candle is a valid pin bar all involve judgment. That makes results hard to backtest and easy to rationalize after a loss. A written checklist helps, such as the approach in our guide to strong vs weak support and resistance zones.
Price action also demands screen time. Reading context improves with hundreds of hours of chart review, which is why many beginners find it harder than it looks.
Head-to-Head on Speed, Subjectivity, and Workload
| Factor | Price action | Indicator-based |
|---|---|---|
| Information source | Candles, swings, levels | Formulas applied to price (and tick volume) |
| Signal speed | Closer to the move | Delayed by the calculation window |
| Subjectivity | High; depends on the trader’s reading | Lower; rules can be coded |
| Noise handling | Raw, so noise is visible | Smoothed, so noise is partly filtered |
| Backtesting | Difficult unless rules are written precisely | Straightforward to automate |
| Learning curve | Slow; screen time matters | Fast to set up, slower to use well |
| Chart clutter | Minimal | Grows with every added tool |
| Typical failure | Seeing patterns that aren’t there | Acting on signals that arrive late or conflict |
The table shows a division of labor more than a winner. Each column’s strength tends to cover the other’s weakness, which is the reason combining them is so common.
Trending Charts, Choppy Charts: One Toolset, Opposite Results
Moving Averages in a Trend, Oscillators in a Range
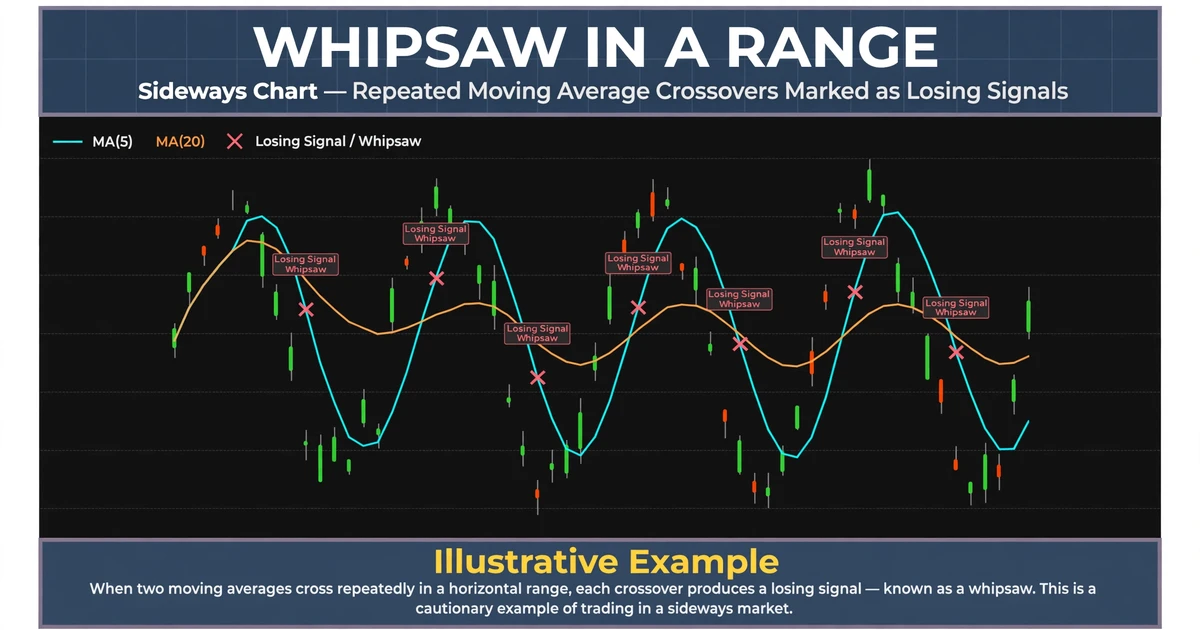
A trending chart flatters moving averages. Price stays on one side of them, their slopes stay aligned, and pullbacks to a rising average often reverse. Oscillators can mislead on that same chart. RSI can sit above 70 for long stretches in a strong uptrend, so treating “overbought” as an automatic sell signal can mean fighting the move again and again.
A range reverses the picture. Moving average crossovers whipsaw, crossing back and forth with no net progress. Overbought and oversold readings near the range edges tend to be more useful, though only if the range is genuine. Price action in a range is clear at the edges and noisy in the middle, where candle patterns carry little meaning.
The Regime Problem Neither Tool Solves
The hardest part is recognizing which environment you’re in, and neither approach does that reliably in real time. Price action offers earlier structural clues, such as a failed swing high or a break of a rising trendline. Indicators tend to confirm the change later. Both can be wrong, and both can be right too late.
One AUD/USD Pullback, Read Three Ways
Picture a trader with a $5,000 USD account who risks 1% ($50) per trade. AUD/USD has been climbing, and price pulls back to 0.6650, a former swing high that broke upward last week. A bullish engulfing candle forms with a low of 0.6642 and closes at 0.6660. The 50-period EMA sits near 0.6640, sloping upward, and RSI(14) has dipped to 44 and turned up.
This is a hypothetical example for illustration only.
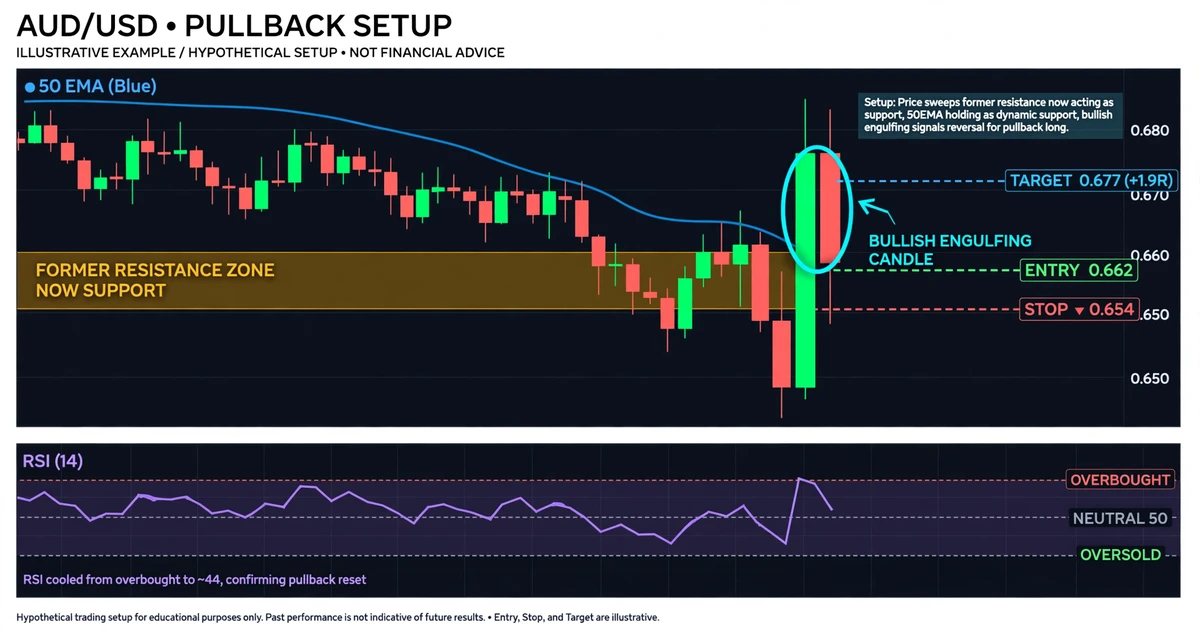
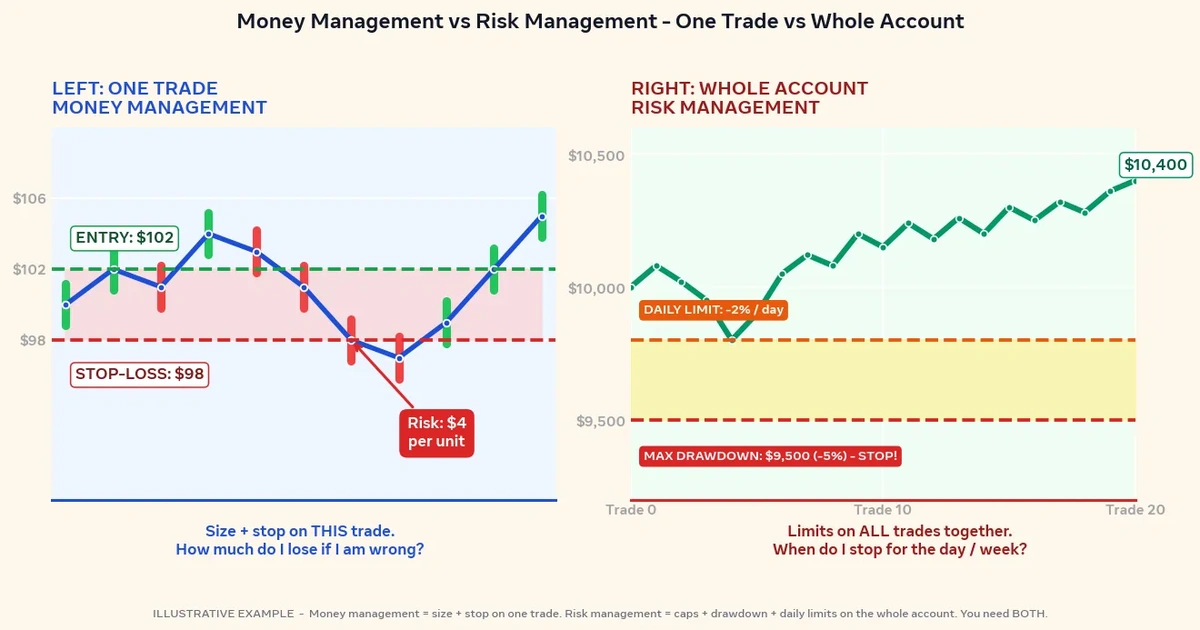
The price-only read. Old resistance is acting as support, the candle shows buyers absorbing the retest, and the swing structure is intact. Entry is 0.6660 at the candle close. The stop goes at 0.6635, below the candle low and the zone, which is 25 pips of risk. The target is 0.6735, or 75 pips, a 3:1 reward-to-risk ratio.
The sizing math. With a USD account, one pip on AUD/USD is worth $10 per standard lot. Position size is $50 ÷ (25 pips × $10) = 0.20 lots. If the target were reached, the gain would be 75 pips × $10 × 0.20 = $150. A one-pip spread would cost about $2 at that size, a small drag that matters more as stops get tighter.
The indicator-only read. A trader whose rule is “buy when RSI falls below 30” skips this setup, because 44 isn’t oversold, even though a shallow dip in an uptrend is the kind of pullback many trend traders look for. A trader using a 20/50 EMA crossover would likely have entered earlier in the move, so their entry would sit well above this pullback low. That means a wider stop, or a smaller position, for the same target.
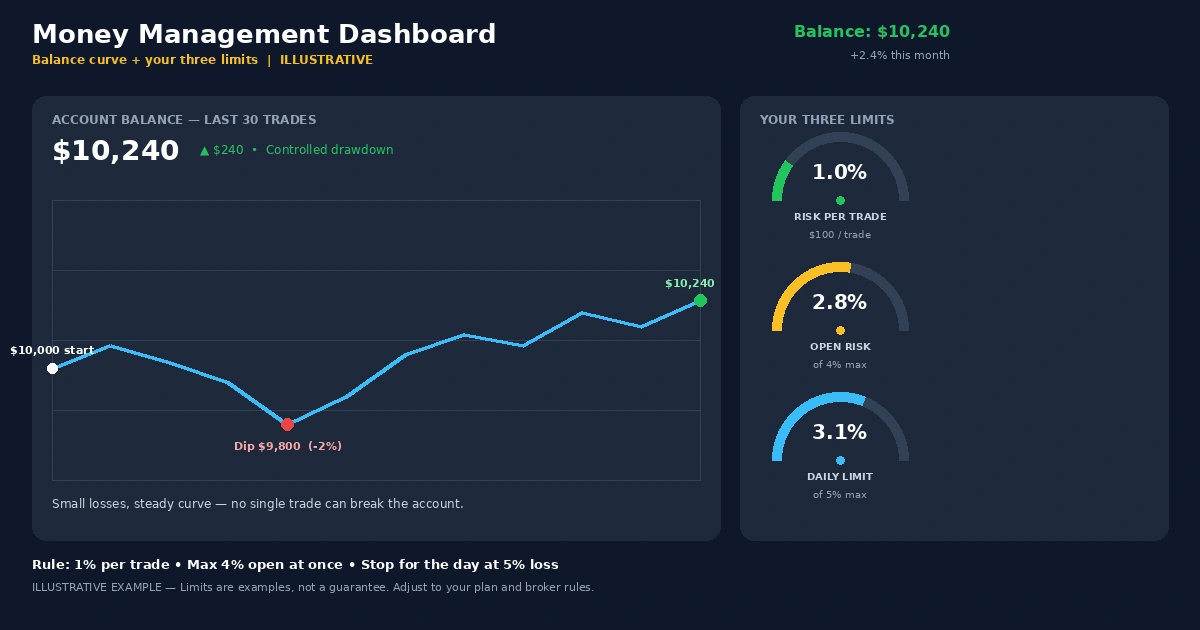
The blended read. Price supplies the location and the trigger. The rising 50 EMA and an RSI holding in the 40s (a zone many trend traders watch during uptrends) suggest the pullback is shallow within an ongoing uptrend. That supports the trend backdrop but doesn’t guarantee anything. If the trade is wrong, the stop is hit and the loss is $50, or 1% of the account.
An engulfing candle can still turn out to be a bull trap, and a 50 EMA can be sliced through by a single news candle. Placing the stop before entry is what keeps either outcome survivable.
Giving Each Tool One Job on the Same Chart
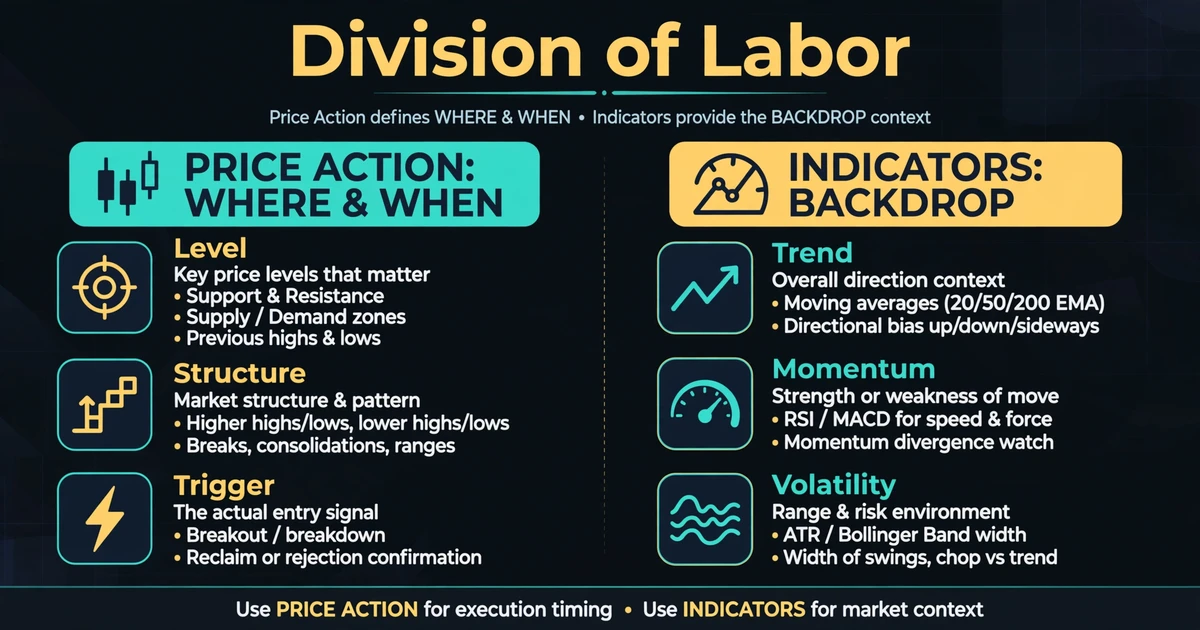
Traders who combine the two approaches usually assign roles. Price action answers where and when: the level, the structure, and the trigger candle. Indicators answer a narrower question, which is whether the backdrop supports the trade.
One Job Per Tool
Pick one trend tool (a moving average) and one volatility or momentum tool (ATR or RSI), and write the job beside each. “50 EMA: only take longs while it slopes up” keeps an indicator in a supporting role. Some traders set stops at a multiple of ATR so stop distance adapts to volatility. The multiple is a choice to test on a demo account, not a rule.
Why a Third Momentum Tool Adds Nothing
RSI, Stochastic, and the MACD histogram all derive momentum from the same closes, so they often agree. That agreement isn’t independent confirmation. Stacking them creates a feeling of certainty without new information, and when they disagree you’re left with extra noise and a harder decision.
Matching the Approach to Your Temperament and Screen Time
A price-led approach suits traders who enjoy reading charts, can wait patiently for a clean setup, and are willing to write down exactly what counts as one. It’s a harder fit for someone who second-guesses easily, because discretion leaves more room for mood to shape decisions.
An indicator-led approach suits traders who want rules specific enough to turn into a checklist or code, and those with limited time, such as someone reviewing daily charts once in the evening. It’s a harder fit for anyone who gets frustrated by late signals or constant whipsaws in sideways markets.
Neither profile is better. They describe where each approach is easier to follow consistently.
Thirty Setups, Two Columns: A Demo Comparison
You can test this on your own charts instead of relying on opinion. Choose one pair and one timeframe. For each setup, write down what your price-only rules would do and what your indicator rules would do before you see the outcome. Log both in a journal.
Track more than wins. Count how many signals each method produced, the average reward-to-risk on each, and how often you broke your own rules. Thirty setups is a small sample, so treat the results as clues rather than proof, and expect them to shift when market conditions change.
Indicator Stacking, Pattern Hunting, and Other Self-Inflicted Wounds
- Treating RSI above 70 as an automatic sell. In strong trends, readings above 70 can persist while price keeps climbing.
- Stacking tools that measure the same thing. Three momentum oscillators agreeing is one opinion repeated three times.
- Hunting for candle patterns everywhere. A pin bar in the middle of nowhere is just a candle. Location is what gives a pattern meaning.
- Retuning settings after each loss. Adjusting a moving average length to fit the last five trades is curve fitting, and it rarely survives new data.
- Calling a method “indicator-free” while keeping the rules in your head. Unwritten rules can’t be tested, and they bend under stress.
- Switching camps after a losing streak. A string of losses is often normal variance, and jumping approaches resets any ability to evaluate either one.
Whipsaws, Gaps, and Overfit Rules: How Both Approaches Fail
No chart method removes risk, and both of these can lose money for entirely ordinary reasons.
- Whipsaws. Indicator signals in sideways markets repeatedly trigger and reverse, and price action setups can fail just as often when a level is misjudged.
- News spikes and gaps. A single announcement can push price through your stop. Weekend gaps can open beyond it. In those cases you may be filled at a worse price than planned (slippage), and the loss can exceed what you intended to risk.
- Leverage. Leverage magnifies losses along with gains, and a series of losing trades on a leveraged account can erode capital quickly. Position sizing based on a fixed stop is one way many traders limit the damage.
- Overfitting. Indicator settings tuned to past data often look strong in a backtest and weaker in live conditions. Discretionary price action is harder to backtest at all, so confidence in it can come from memory rather than data.
- Psychological pressure. Both approaches can fail at the moment you override your own rules, whether that’s moving a stop, skipping a valid signal, or adding a tool mid-trade because you feel uncertain.
Straight Answers on the Indicator Debate
Is price action better than indicators?
There’s no universal answer. Price action responds faster and shows structure directly, but it relies on judgment. Indicators are easier to turn into fixed rules but lag the market. What matters more is whether you apply either one with a defined stop, consistent risk, and rules you can test on a demo account.
Can you trade with only indicators and no price action?
You can, but you’d still be reading price indirectly, because every indicator is calculated from it. Purely indicator-driven systems tend to ignore context such as nearby support or resistance, which is where many of their worst signals appear. Most traders who rely on indicators still glance at levels and candles before acting.
Which indicators do price action traders usually add?
Common choices are a moving average such as the 20 or 50 EMA for trend direction, RSI for momentum, and ATR for stop distance. None is required, and none is universally preferred. A reasonable limit is one or two, each with a defined job, so the chart stays readable and your rules stay testable.
Do professional traders use indicators?
Practice varies widely. Some professionals rely on fundamentals, order flow, or quantitative models, while others use technical tools, including indicators, alongside price levels. There’s no reliable public breakdown of who uses what, so treat claims that “pros only use X” with skepticism. Judge a method by whether it fits your rules and risk limits.
Is price action easier for beginners?
Price action looks simpler because the chart is clean, but reading it consistently takes substantial chart time. Indicators feel easier because they give clear-looking signals, yet beginners often misuse them, such as selling every overbought reading. Neither is truly easier. Starting with price structure on a demo account, then adding one indicator, is a common learning path.
Price Is the Evidence, Indicators Are the Second Opinion
Indicators can’t see anything that price hasn’t already printed, and price alone can’t give you consistency unless the rules are written down. That’s the whole debate in one line, and it’s why the useful question is which blend fits your schedule and temperament. Your next move can be simple: note how many hours you can realistically watch charts each week, then read how to choose your trading style so the timeframe and tools match that answer.
Disclaimer
This article is for educational purposes only and is not financial advice. Forex and CFD trading involves a high level of risk, and you can lose some or all of your capital. Leverage can magnify both gains and losses. Never trade with money you can’t afford to lose.
This is a trading framework, not a guarantee. No strategy wins every trade, and results vary with market conditions, execution, and risk management.
Any percentages or figures shown are historical averages or hypothetical examples, not guarantees. Past performance does not predict future results.
Join now
Comments (0)
Be the first to comment.