
Fibonacci Retracement Explained: How to Use It in Forex
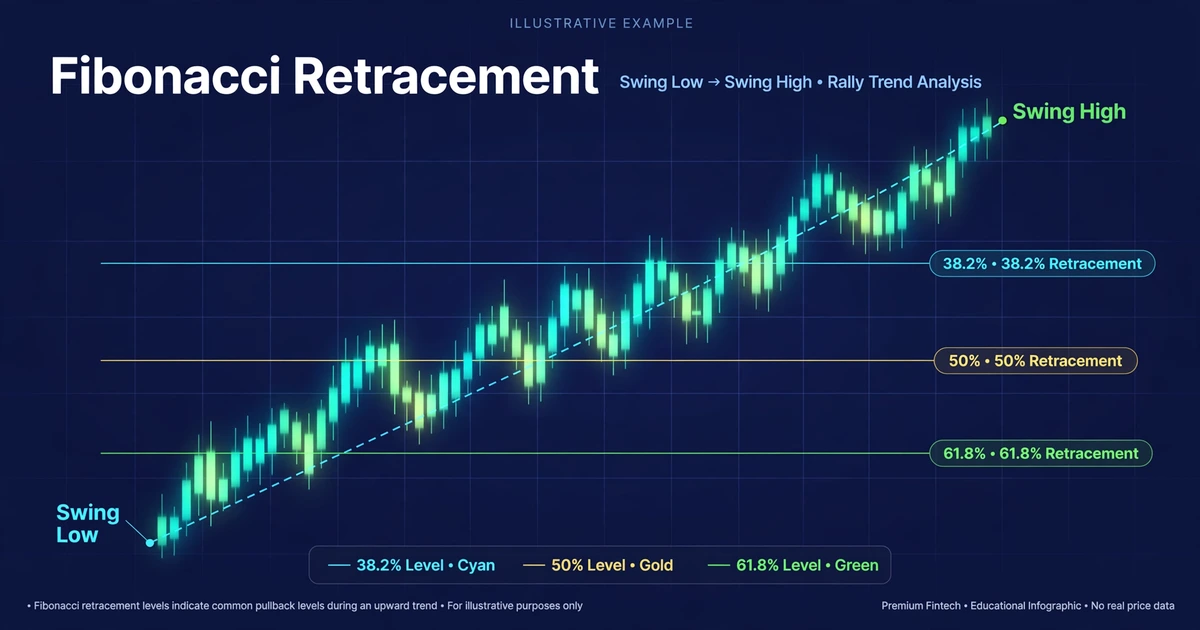
A pair rallies 300 pips, then slides back 150 of them. One trader sees a sell-off. Another sees a pause where buyers might step in, and has already drawn a grid on the chart to mark it. That grid is Fibonacci retracement: horizontal lines placed at set fractions of a prior price swing, showing where a pullback (a temporary move against the main trend) may stall.
This article covers where the levels come from, how to anchor them on forex charts, and why a level alone is never enough to justify a trade. Everything here is a framework to test, not a prediction.
Five Levels, Two Anchors, One Catch
- Five levels: 23.6%, 38.2%, 50%, 61.8%, and 78.6% of the prior swing. Traders watch them as possible areas where a pullback pauses or reverses.
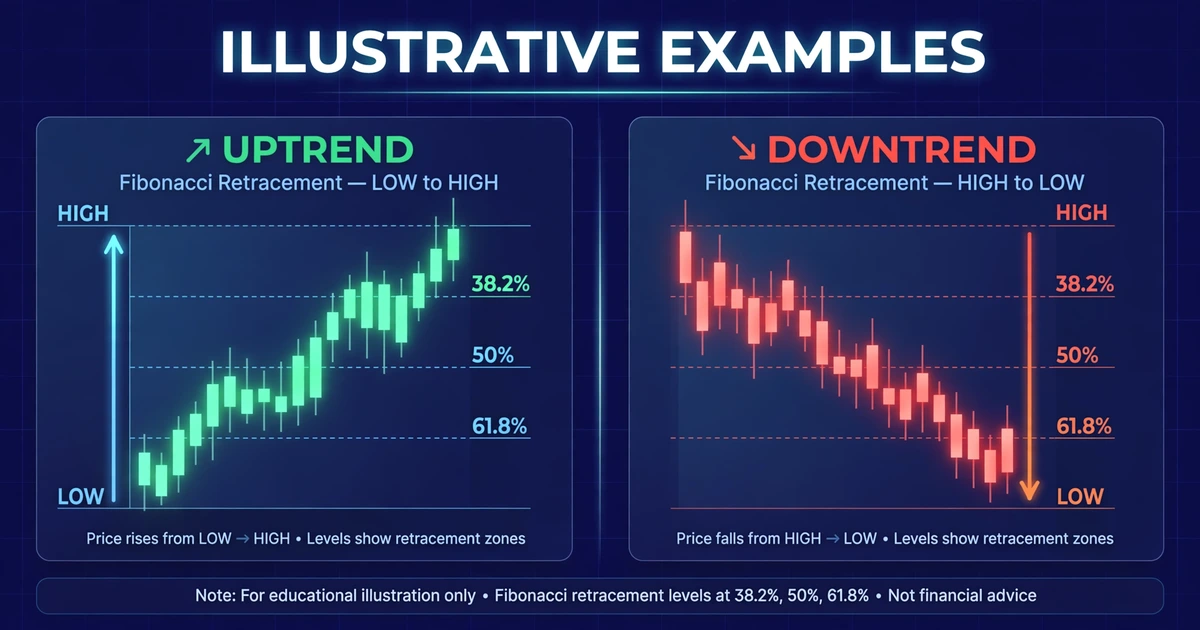
- Two anchors: the swing low and swing high you measure between. After a rally you draw from low to high; after a sell-off, from high to low.
- How to read them: shallow pullbacks (38.2% or less) suggest a strong trend. Deeper ones (61.8% to 78.6%) suggest the trend is losing momentum.
- The catch: a level is a reference point, not a signal. Price can slice through any of them, so you need confirmation and a stop-loss.
Where the 38.2%, 50%, and 61.8% Numbers Come From
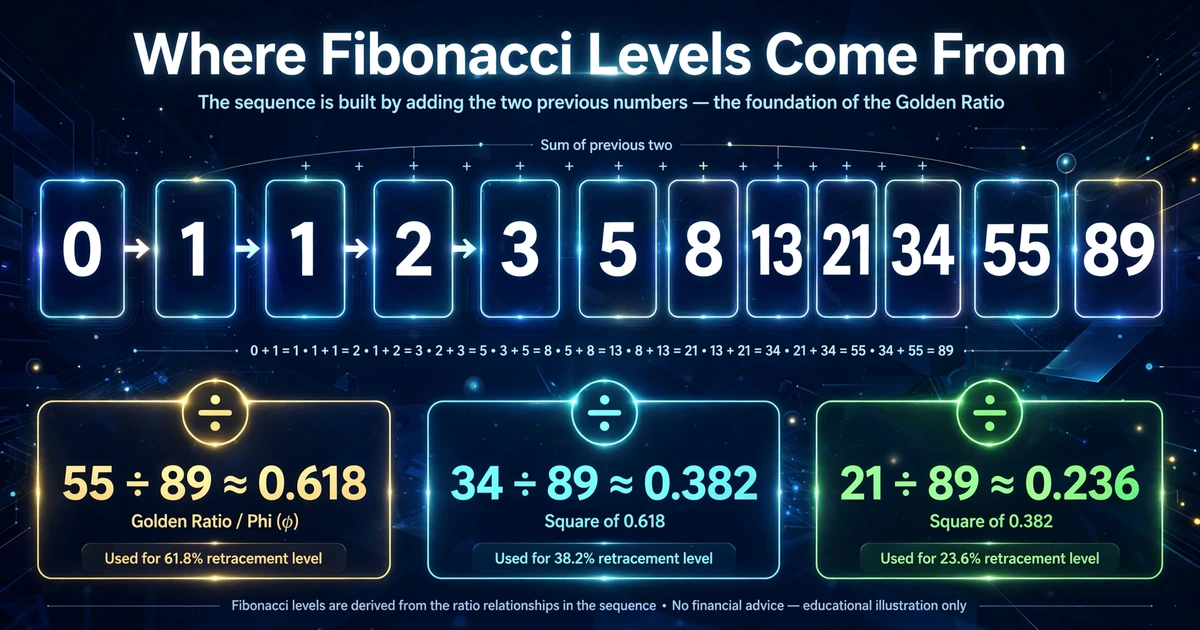
The Fibonacci sequence starts 0, 1, 1, 2, 3, 5, 8, 13, 21, 34, 55, 89, and each number is the sum of the two before it. The ratios come from dividing numbers in that sequence:
- Divide a number by the next one (55 ÷ 89) and you get about 0.618, or 61.8%.
- Divide it by the number two places ahead (34 ÷ 89) and you get about 0.382, or 38.2%.
- Divide it by the number three places ahead (21 ÷ 89) and you get about 0.236, or 23.6%.
Two levels don’t come from the sequence. The 50% level is a convention borrowed from the old idea that markets often give back about half of a move. The 78.6% level is the square root of 0.618.
There is no proven reason why currency prices should respect these ratios. Some traders argue the levels work because so many people watch them. Others call that confirmation bias. We’ll come back to that debate later.
Anchoring the Grid on a Swing
A swing high is a peak with lower prices on both sides. A swing low is a trough with higher prices on both sides. The Fibonacci retracement tool in most charting platforms asks for two clicks, one at each end of the swing.
Most platforms put 0% at the end of the swing and 100% at its start. That way each level shows how much of the move has been given back.
Drawing It After a Rally
Click the swing low first, then drag to the swing high. The levels appear below the high, and the 61.8% line sits 61.8% of the way back down toward the low. You’re looking for support: places where buyers might re-enter in the direction of the original uptrend.
Drawing It After a Sell-Off
Reverse it. Click the swing high first, then drag to the swing low. The levels appear above the low, and you’re looking for resistance where sellers might re-enter.
The same discipline applies as when drawing trendlines correctly: start from clear, visible points rather than ones you had to squint to find.
Shallow, Middle, and Deep Pullbacks: What Each Level Suggests
| Level | What the pullback depth hints at | How traders often treat it |
|---|---|---|
| 23.6% | Very shallow; trend momentum is strong | Rarely a stand-alone zone; often too close to the high to offer a good stop |
| 38.2% | Shallow; buyers (or sellers) are aggressive | First area many trend traders watch |
| 50% | Moderate; a conventional halfway mark | Watched alongside 61.8% as one wider zone |
| 61.8% | Deep but common; trend still intact | Widely cited “golden ratio” level |
| 78.6% | Very deep; trend may be failing | Last stop before the whole swing is erased |
Beyond 100%, price has erased the entire swing and the grid no longer applies. Delete it and look for a new swing.
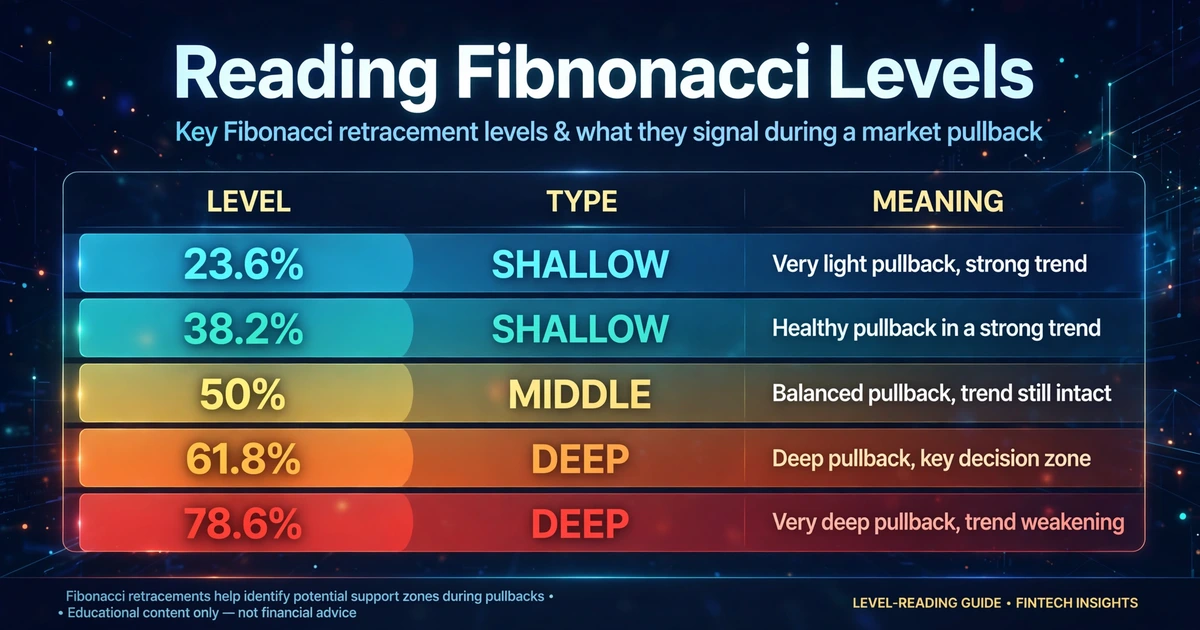
None of these meanings is a rule. A 38.2% pullback that holds doesn’t make a trend “strong,” and a 61.8% pullback that fails doesn’t make it “weak.” The levels describe where traders look, not what price must do.
Choosing Swings That Don’t Bend the Grid
Two traders can draw different grids on the same chart and both be technically correct. A few habits keep your anchors consistent:
- Pick the swing that’s obvious on your trading timeframe. If you have to hunt for it, skip it.
- Choose wicks or closes and stick with it. Mixing them shifts the levels by several pips and makes your results impossible to review.
- Use higher timeframes for more weight. A swing on the daily or 4-hour chart is built from more trading activity than one on the 5-minute chart, and small swings produce tightly packed levels that overlap everything.
- Don’t redraw after the fact. Moving an anchor until price “respects” a level is hindsight, and it will make the tool look more accurate than it is.
- Draw two grids if two swings are plausible. Where levels from different swings overlap, you get a narrower cluster to watch.
A Fib Level Needs Company Before It Earns a Trade
Price will often be near some level on a five-line grid. A trade idea gets stronger when the grid agrees with something independent. Common companions include:
- A previous swing high or low that sits at the same price. Checking whether the area is a strong or weak support and resistance zone is the most common filter.
- A trendline or a moving average passing through the level.
- A round number such as 0.6500 or 150.00.
- A confirmation candle at the level, such as an engulfing bar or a pin bar with a long rejection wick. The guide to advanced candlestick patterns covers how to judge those.
Overlap isn’t proof, but it narrows your attention to the few places worth watching.
Walking a 300-Pip AUD/USD Rally Through the Grid
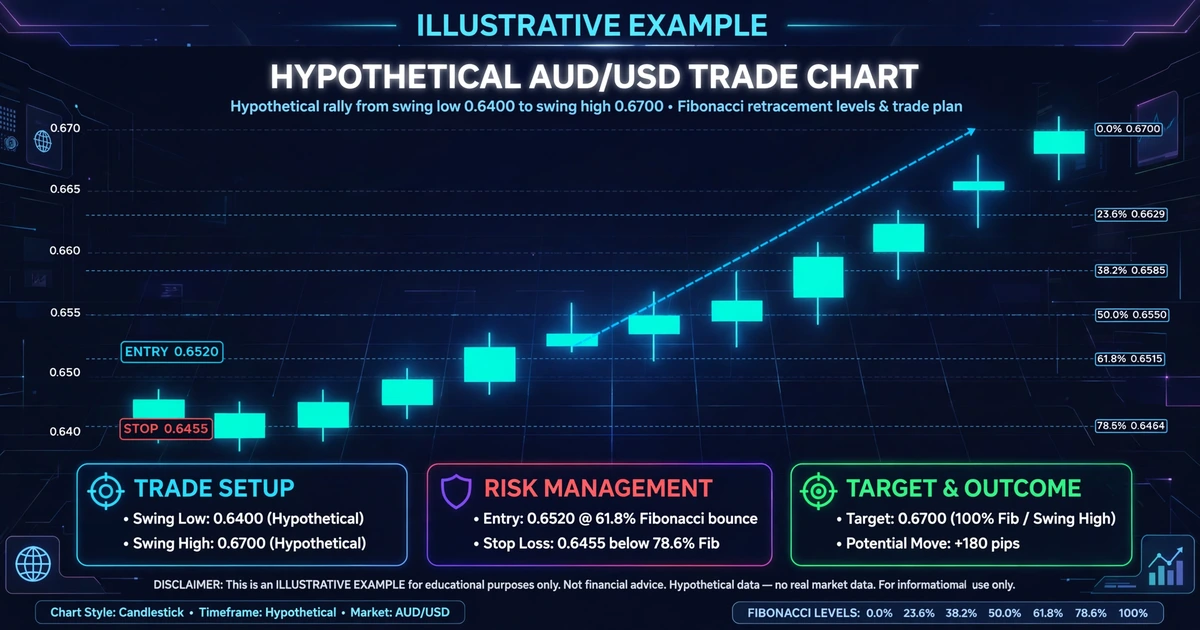
Here’s how the pieces fit together on an illustrative chart. All prices are invented.
Setup: AUD/USD rallies from a swing low at 0.6400 to a swing high at 0.6700. That’s 300 pips (0.0300). You draw the grid from low to high and calculate each level by subtracting the percentage of the swing from the high:
| Level | Calculation | Price |
|---|---|---|
| 23.6% | 0.6700 − (0.0300 × 0.236) | 0.6629 |
| 38.2% | 0.6700 − (0.0300 × 0.382) | 0.6585 |
| 50% | 0.6700 − (0.0300 × 0.500) | 0.6550 |
| 61.8% | 0.6700 − (0.0300 × 0.618) | 0.6515 |
| 78.6% | 0.6700 − (0.0300 × 0.786) | 0.6464 |
The pullback: Price falls to the 61.8% area at 0.6515, where an earlier resistance zone from the previous week also sits. A bullish engulfing candle closes at 0.6520. Two independent clues now overlap, plus a confirmation candle.
The plan:
- Entry: 0.6520, after the confirming candle closes.
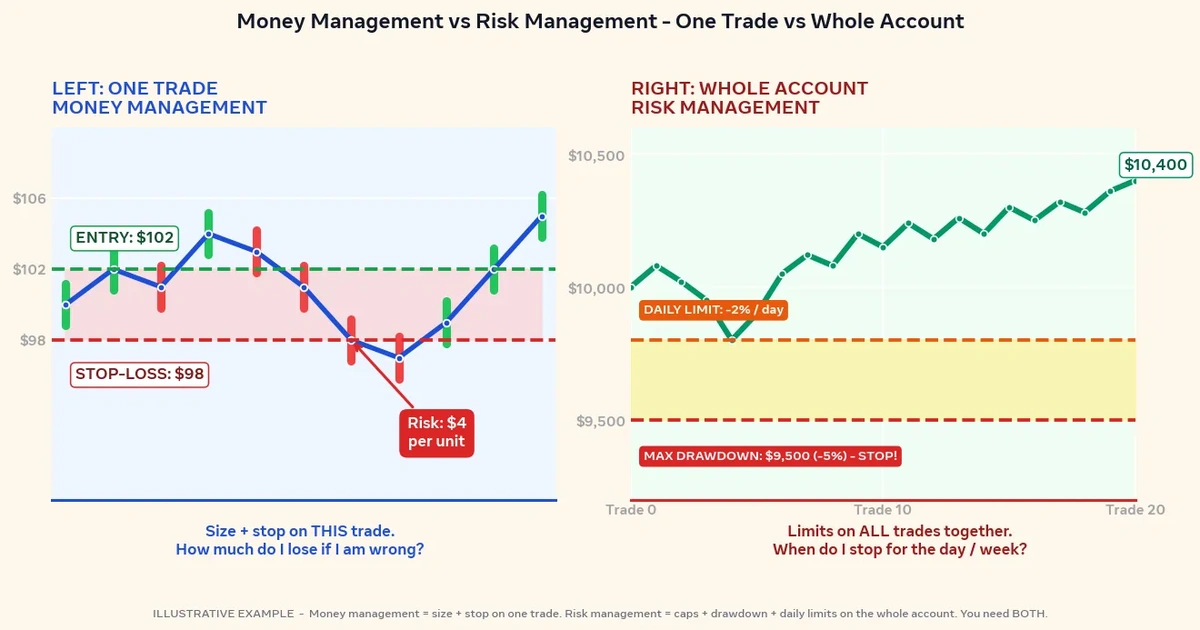
- Stop-loss: 0.6455, just below the 78.6% level at 0.6464. That’s 65 pips of risk (0.6520 − 0.6455 = 0.0065).
- Target: the prior high at 0.6700, which is 180 pips away (0.6700 − 0.6520 = 0.0180). The reward-to-risk ratio is 180 ÷ 65, or about 2.8 to 1.
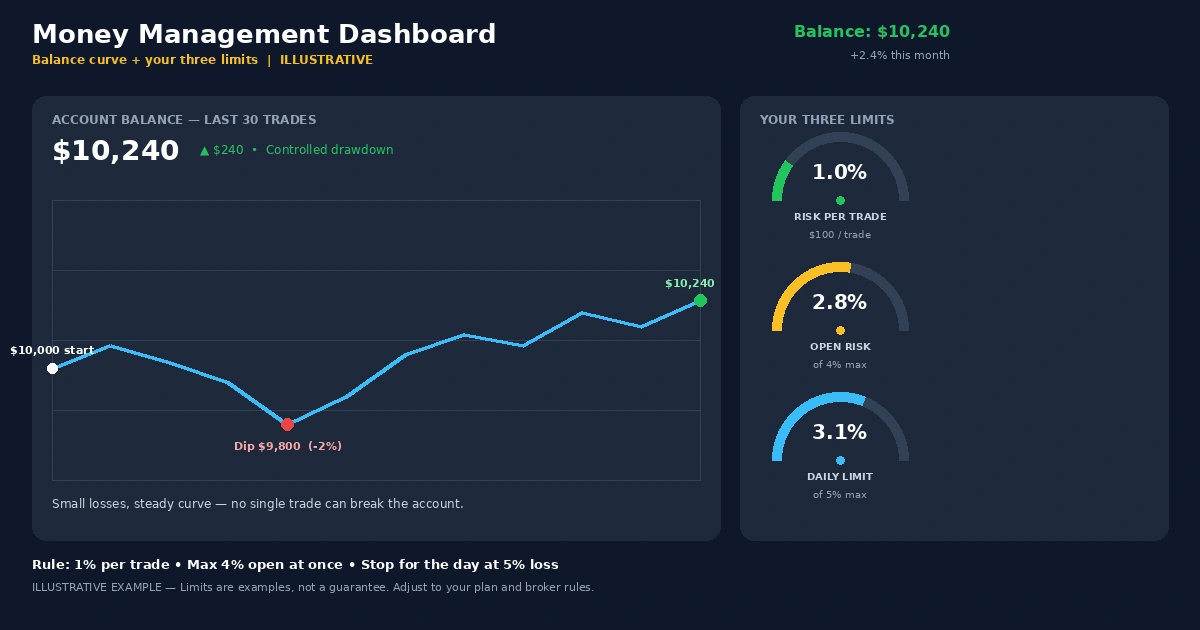
Position size: Assume a $5,000 account in U.S. dollars and a plan to risk 1% ($50). Many traders risk a small fixed percentage per trade, and the right level depends on your own situation. On AUD/USD, one pip on a micro lot (1,000 units) is worth about $0.10.
$50 ÷ (65 pips × $0.10) = 7.69 micro lots, which rounds down to 7 micro lots.
- If the stop is hit: 7 × 65 × $0.10 = $45.50 loss.
- If the target is hit: 7 × 180 × $0.10 = $126 gain.
Spread, commission, and slippage would shift both figures in real trading. A stop-loss can also fill beyond your set price during fast markets or gaps, so the actual loss can be larger than planned.
If price closed below 0.6455 instead, the idea would be wrong, and the exit is the plan working as intended.
This is a hypothetical example for illustration only.
Projecting Targets Beyond the Old High With Extensions
The retracement tool maps where a pullback might end. Once price resumes the trend and passes the old high, you need a different question answered: how far could it run?
Many platforms include a Fibonacci extension tool that uses three points: the swing start, the swing end, and the pullback low. It projects levels beyond 100%, most commonly 127.2% and 161.8%. Traders use them as possible profit-taking zones.
They carry the same limits as retracements. They’re reference points, not forecasts, and many traders use prior swing highs or lows as targets instead.
Six Ways a Misdrawn Grid Misleads You
- Anchoring on tiny swings. The levels land a few pips apart, so something always “hits.”
- Using an outlier spike. A one-candle wick caused by a news release stretches the grid and shifts every level.
- Treating a level as a limit order. Placing a buy at 61.8% without waiting for confirmation means you take every failure.
- Applying the tool in a sideways market. With no clear swing, there’s nothing to retrace, so the levels mean little.
- Parking the stop exactly on the level. It’s the obvious place, and price often pokes through it before turning. Placing it beyond the next level or a structural point gives the trade room.
- Reviewing only the hits. If you don’t log the times price blew through the levels, the tool will always look better than it is.
When Fibonacci Levels Fail, and Why Skeptics Have a Point
Skeptics raise three fair points. First, no research establishes that these ratios hold in currency prices. Second, if price stalls near them because traders place orders there, the effect is self-reinforcing only while enough traders watch the same swing. Third, with five levels on the screen, price often lands near one of them, which makes it easy to remember the hits and forget the misses.
Practical risks to plan for:
- Levels that don’t hold. In strong trends price can ignore 38.2% and 50% completely, or run through 78.6% in one candle.
- Gaps and fast markets. A news release can jump over your stop, and the fill can be worse than planned.
- Leverage. It magnifies gains and losses alike, so a stop that looks tight on a chart can still cost more than you intended at larger position sizes. Some traders can lose all the capital in their account.
- Backtest versus live. Drawing grids on old charts is easy, because you already know which swing mattered. Live, you must choose without that hindsight. A framework for sizing risk is in the forex risk management complete guide.
Who May Get Little Out of It
Traders who can’t define a swing in the same way twice, who trade without stops, or who want a mechanical signal may find this tool frustrating. It involves judgment, and judgment needs a journal to improve.
Straight Answers on Fib Levels, Anchors, and Timeframes
Which Fibonacci retracement level do traders watch most often?
The 38.2%, 50%, and 61.8% levels draw the most attention, with 61.8% often called the “golden ratio” level. That popularity doesn’t make any of them reliable. Each is simply a place where traders look for confirmation.
Does Fibonacci retracement work in forex?
It’s debated. There’s no proof that the ratios have special power, but many traders use them as a consistent map for entries, stops, and targets. Whether it adds value for you is something to test on a demo account, with a record of hits and misses.
What timeframe should I use?
Any timeframe works mechanically. Swings on the 4-hour and daily charts usually carry more weight and produce fewer random hits than 5-minute swings. Choose the timeframe that matches how long you plan to hold trades.
How do I draw Fibonacci retracement in a downtrend?
Click the swing high first and drag to the swing low. The levels will appear above the low, and you watch them as possible resistance where a bounce might fail.
What happens if price breaks through the 61.8% level?
Price often moves on to 78.6%. A close beyond the swing’s starting point cancels the setup, and you’d delete the grid and look for a new swing.
Draw Ten Grids Before You Trust One
Fibonacci retracement is a way of turning a pullback into a handful of price areas to watch. It’s most useful when you draw the grid the same way every time and wait for the chart to confirm it. Before risking money, open a chart and mark ten past swings. Write down which levels price respected, which it ignored, and what else was nearby. If the pattern isn’t clear after ten, that’s useful information too.
Disclaimer
This article is for educational purposes only and is not financial advice. Forex and CFD trading involves a high level of risk, and you can lose some or all of your capital. Leverage can magnify both gains and losses. Never trade with money you can’t afford to lose.
This is a trading framework, not a guarantee. No strategy wins every trade, and results vary with market conditions, execution, and risk management.
Any percentages or figures shown are historical averages or hypothetical examples, not guarantees. Past performance does not predict future results.
Join now
Comments (0)
Be the first to comment.