
What Is Smart Money Concept (SMC) in Forex? A Beginner’s Guide
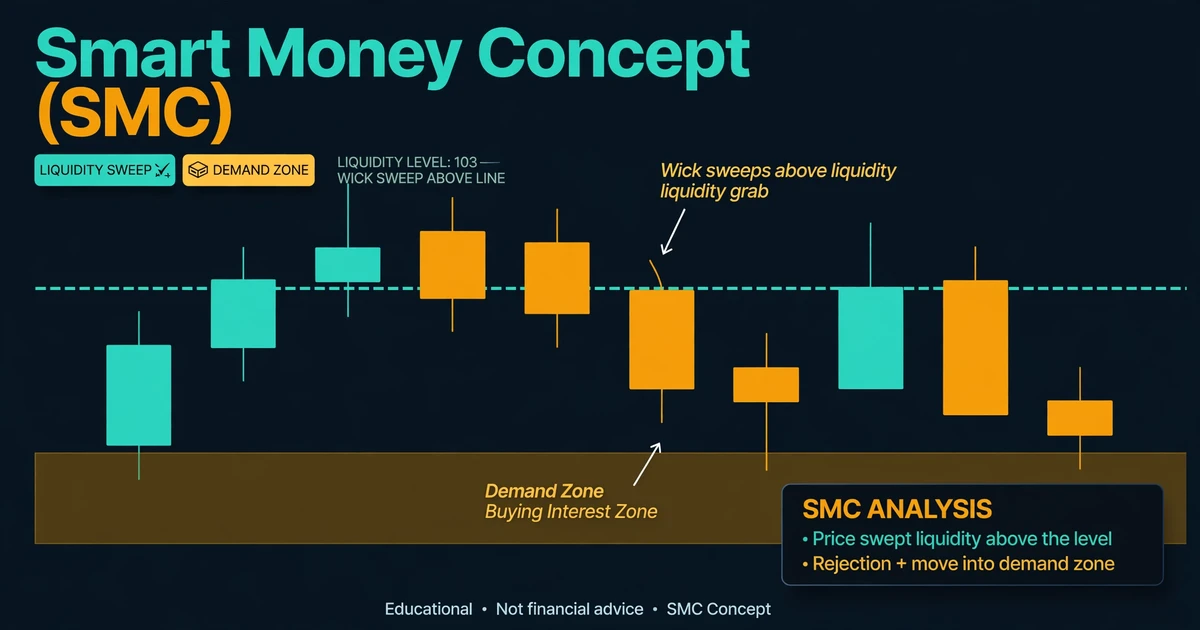
A trader buys a bounce off a clean support level, puts the stop just below it, and gets stopped out by three pips. Price then reverses and runs eighty pips without them. It feels targeted, and Smart Money Concept (SMC) is the framework built around that feeling. SMC is a price-action approach that assumes large institutions leave readable footprints in the chart, especially around obvious highs and lows where many stop orders rest. Below you’ll find the vocabulary, a hypothetical trade that uses it, the criticisms traders raise, and the risks, so you can judge it on your own charts.
SMC Boiled Down to Three Ideas
- Structure: SMC reads trend through swing highs and lows, and treats a break of the last swing against the trend as an early warning.
- Liquidity: Resting stop orders gather above obvious highs and below obvious lows. SMC traders watch for price to sweep those areas before reversing.
- Zones: Order blocks and fair value gaps mark areas where price moved fast, and traders watch them for a return visit.
SMC is a framework to test, not an established fact, and traders disagree about how well it works.
Who Counts as “Smart Money,” and the Claim Behind the Name
In SMC language, smart money means large institutional participants such as banks and hedge funds. Our guide on who trades forex shows how these groups differ from individual traders with small accounts, who SMC labels “retail.”
The central claim is about order size. A very large order can’t be filled instantly at one price without moving the market, so the argument goes that big players need other traders’ orders to trade against. Retail stop-losses and breakout entries tend to cluster at obvious highs and lows. SMC calls these clusters liquidity. Price is then said to move toward them, let institutions fill their orders, and reverse.
There are two honest caveats. First, spot forex is decentralized, so retail traders can’t see institutional order flow. SMC infers it from candles, which makes it an interpretation, not an observation. Second, nobody outside the large institutions can confirm that a particular move was deliberate. Treat the story as a working model for reading charts, because that’s all it can be shown to be.
Reading Structure: Swing Points, Break of Structure, and Change of Character
SMC starts with trend, defined through swing points. A swing high is a peak with lower highs on both sides, and a swing low is a trough with higher lows on both sides. Because SMC uses candles and levels rather than indicators, it sits inside the wider family of price action trading.
Break of Structure (BOS)
In an uptrend, price makes higher highs and higher lows. A break of structure happens when price closes above the previous swing high, which suggests the trend is continuing. In a downtrend, the mirror image is a close below the previous swing low.
Change of Character (CHoCH)
A change of character is the first break against the trend. In an uptrend, it’s a close below the most recent higher low. In a downtrend, it’s a close above the most recent lower high. SMC traders read it as an early sign the trend may be shifting, not as proof.
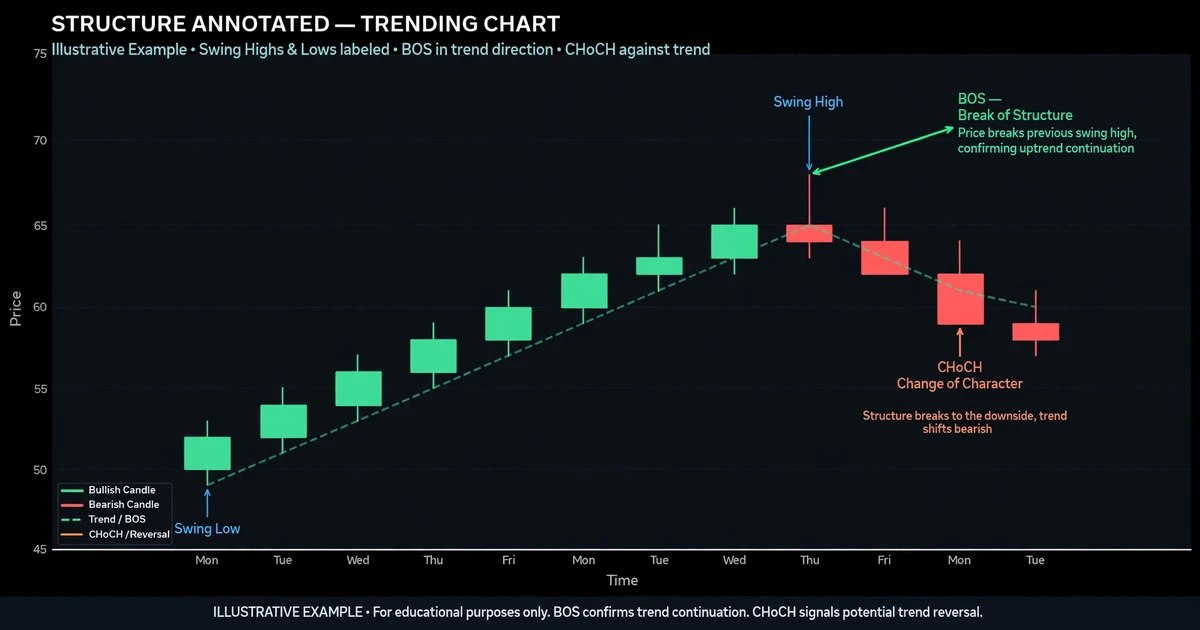
Definitions vary. Some traders require a candle close beyond the level and others accept a wick. Pick one rule and apply it consistently, or your charts will change with your mood.
Liquidity: Why Equal Highs and Lows Draw So Much Attention
In SMC terms, liquidity is a cluster of resting orders. Buy-side liquidity sits above highs, where short sellers’ stops and breakout buy orders gather. Sell-side liquidity sits below lows, where long positions’ stops and breakout sell orders gather. Two or more touches at nearly the same price, called equal highs or equal lows, are treated as especially obvious pools.
A liquidity sweep (also called a grab) happens when price pushes briefly beyond such a level, then closes back inside the prior range. The wick through the level is the sweep. SMC traders treat a sweep followed by a strong move in the other direction as a possible reversal clue.
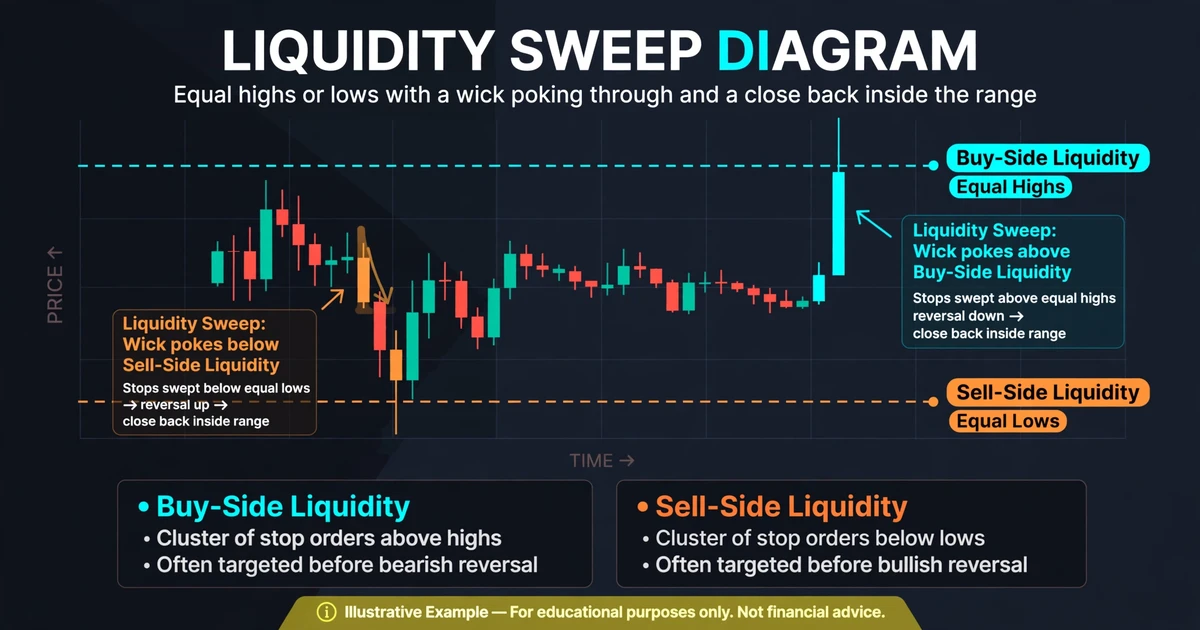
Sweeps are easy to spot after the fact. In real time, a move beyond a high might be a sweep or it might be the start of a breakout, and the two look identical until later candles print. That uncertainty is the main practical problem with trading them.
Order Blocks and Fair Value Gaps: The Two Zones SMC Traders Mark
Order Block
An order block (OB) is usually defined as the last opposite-colored candle before a strong move that breaks structure. The last down candle before a sharp rally is a bullish order block. The last up candle before a sharp drop is a bearish one. The idea is that this candle’s range marks where large orders may have been placed, so traders watch for price to return to it.
Unlike a classic zone built from repeated touches, an order block is drawn from a single candle. That’s one reason it differs from the way many traders judge strong vs weak support and resistance zones, and one reason it needs extra rules to avoid marking one on every pullback.
Fair Value Gap
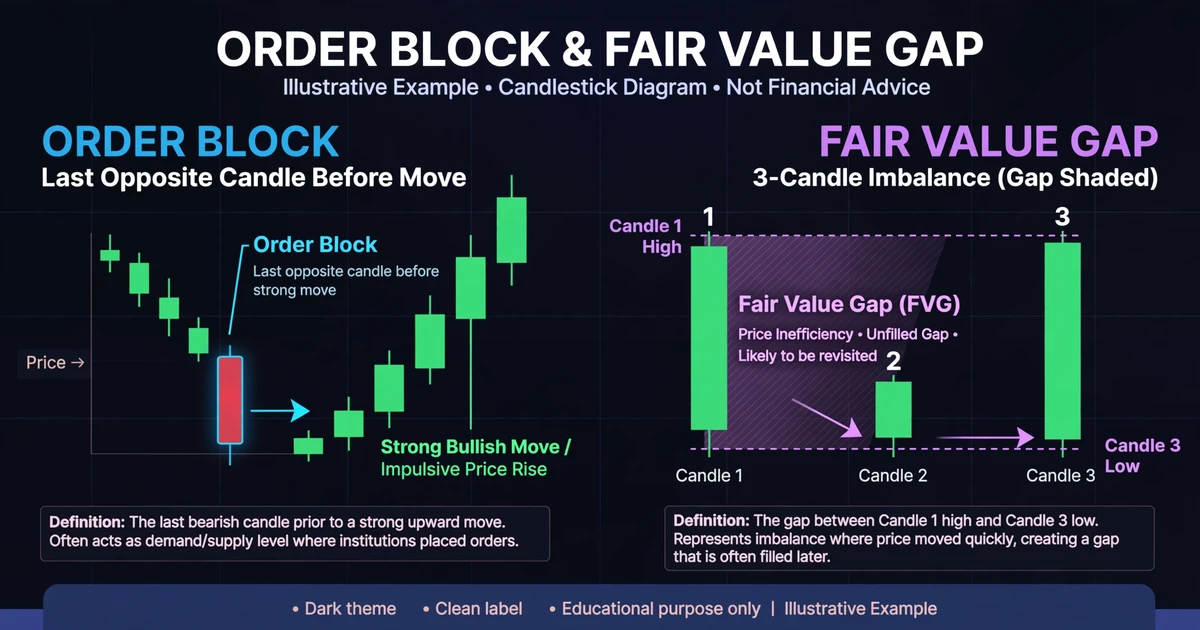
A fair value gap (FVG) is a three-candle pattern where the move is so fast that the wicks of the first and third candles don’t overlap. In a bullish FVG, the first candle’s high sits below the third candle’s low, and the space between them is the gap. The theory is that price moved too quickly to trade evenly through that area, so it may come back to fill part of it. Whether it does is a matter of testing, since many gaps are never revisited and many are overshot.
Premium and Discount: Buying Low Inside the Range
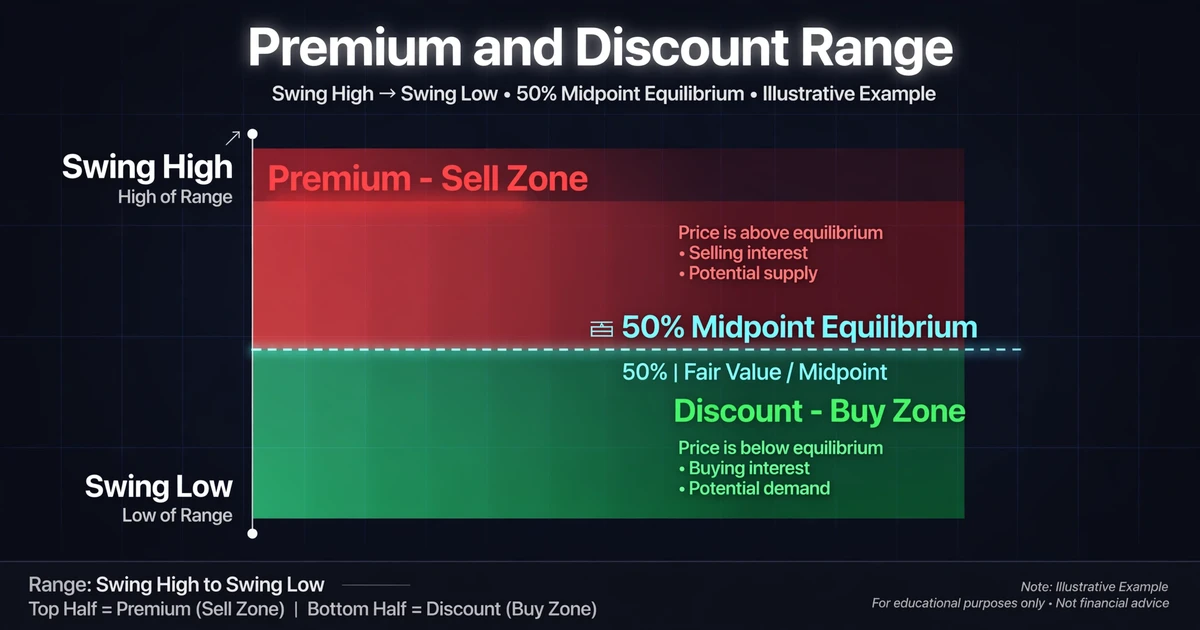
SMC traders often draw a line between the most recent significant swing high and swing low and mark its midpoint as equilibrium. Prices above the midpoint are “premium” and prices below it are “discount.” The rule many follow is to look for buys in discount when bias is bullish, and sells in premium when bias is bearish. It’s a location filter and nothing more, and it doesn’t turn a weak setup into a strong one.
SMC and ICT: Shared Vocabulary, Different Emphasis
Much of SMC’s vocabulary, including order blocks, fair value gaps, and liquidity sweeps, is widely associated with ICT-style teaching, which adds time-based ideas such as specific trading windows. Our overview of ICT trading covers those additions. The two communities overlap but sometimes define terms differently, and neither is a single standardized method.
Walking One GBP/USD Sweep-and-Reverse Through the SMC Checklist
Imagine GBP/USD has been trending down on the 1-hour chart, with the most recent lower high at 1.2690. A trader with a $3,000 account who risks 1% ($30) per trade is watching. Here’s the sequence on the chart:
| Chart event | Hypothetical level | What an SMC trader notes |
|---|---|---|
| Equal lows | 1.2640 | Sell-side liquidity resting below |
| Sweep | Wick to 1.2625, close at 1.2645 | Liquidity taken, price rejected |
| Shift | Close above 1.2690 | CHoCH: first break against the downtrend |
| Fair value gap | 1.2668 to 1.2678 | Imbalance left by the rally |
| Order block | 1.2645 to 1.2665 | Last down candle before the rally |
This is a hypothetical example for illustration only.
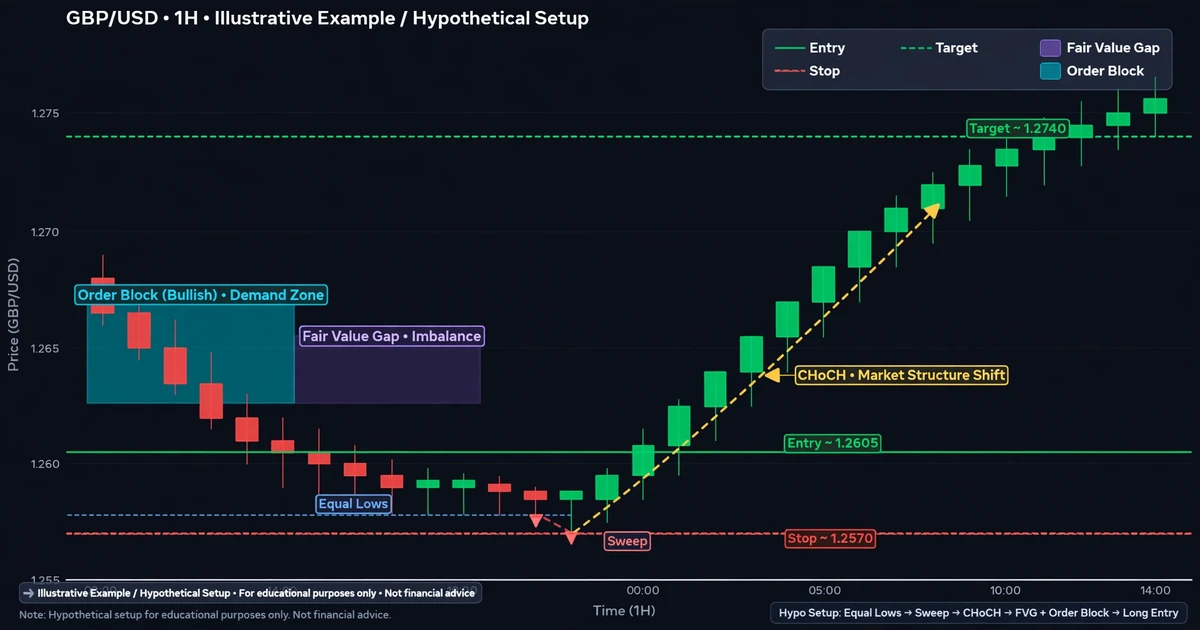
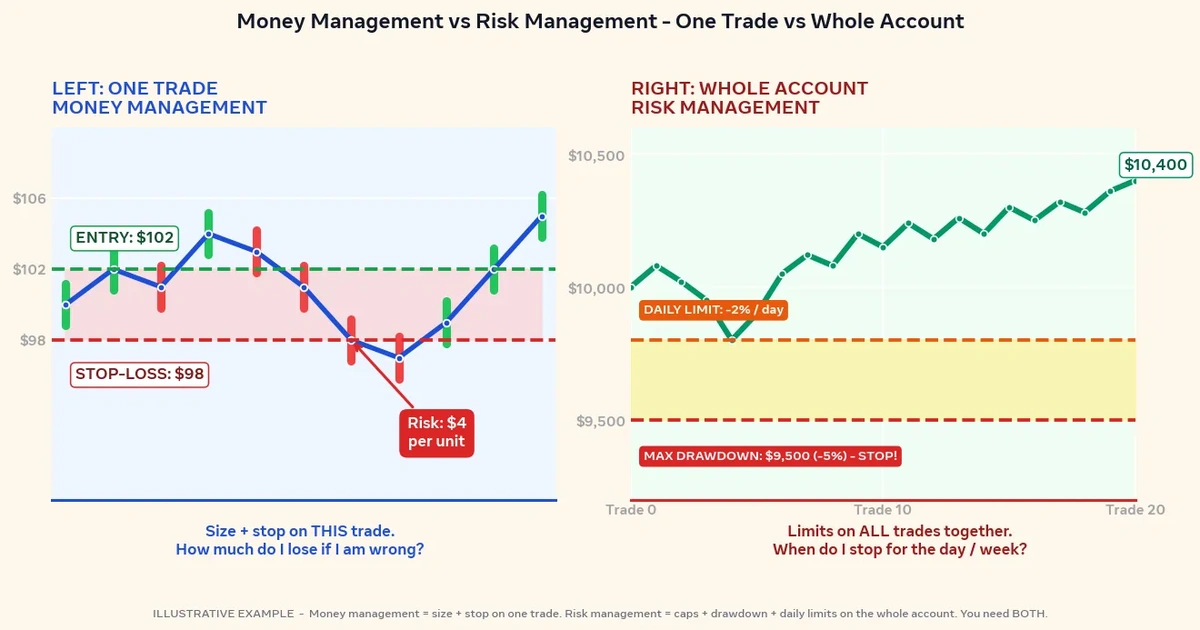
The trader plans a buy limit order at 1.2662, inside the order block, with the stop at 1.2620, five pips under the sweep low. That’s 42 pips of risk. The target is the buy-side liquidity near the previous swing high at 1.2788, which is 126 pips away, a 3:1 reward-to-risk ratio.
For sizing, a pip on GBP/USD is worth $10 per standard lot in a USD account. Position size is $30 ÷ (42 pips × $10) = 0.0714 lots, rounded down to 0.07 lots (seven micro lots). Actual risk is 0.07 × 42 × $10 = $29.40, and the gain at target would be 0.07 × 126 × $10 = $88.20. A one-pip spread costs about $0.70 at this size.
Notice what makes this a plan rather than a prediction: the invalidation point is defined before entry. If price trades down to 1.2620, the idea is wrong and the loss is about $29.40. It’s equally possible that the limit order never fills because price rallies without retracing, or that a second sweep takes out the stop before any rally. Waiting for a retrace can mean missing a trade entirely.
The Case Against SMC, Stated Fairly
- Hindsight. Zones and sweeps look obvious once the move has happened. Live, the same candles are ambiguous.
- Flexible definitions. Nearly any pullback can be labeled an order block, so the framework can explain almost any outcome, and an explanation that fits every outcome is hard to test.
- An unverifiable premise. Retail traders can’t see institutional order flow in spot forex, so “smart money intent” is inferred, not observed.
- Crowding. If many traders mark the same liquidity levels, behavior at those levels may change, and any edge may not persist.
- Limited testing. Independent, rigorous tests of specific SMC rules are limited, and most claims circulate through educators and social media.
Supporters respond that SMC is a structured way to read price rather than a claim to know institutional orders, and that its real value is forcing a trader to define invalidation before entering. Both points have merit. The way to settle it for yourself is to test.
Zone Overload, Hindsight Charts, and Other Beginner Habits
- Marking every pullback candle as an order block. If every candle qualifies, the label tells you nothing.
- Drawing zones on a past chart where you already know the outcome, then believing you’d have taken the trade live.
- Ignoring higher-timeframe context, such as buying a 5-minute bullish order block while the daily structure is clearly bearish.
- Switching between wick and close rules depending on which makes the chart look better.
- Treating every sweep as a signal, whether or not it’s near a meaningful level.
- Stacking terms (order block, fair value gap, premium, sweep) until a setup always seems to qualify.
- Copying a social media trader’s entries without understanding where the idea is invalidated.
Stops Under Sweeps and Other Ways SMC Trades Lose Money
SMC trades can lose for ordinary reasons, and the framework doesn’t remove any of them.
- Wide stops. Placing a stop beyond a sweep wick can mean a long distance. To keep dollar risk fixed, the position gets smaller, so costs like spread and commission take a larger share of the potential gain.
- Repeat sweeps. Price can take out a level, return, and sweep it again before moving, which can stop you out of a correct idea.
- Unfilled orders and slippage. Limit orders at a zone may not fill, or may fill partially. Stops can fill at worse prices during fast markets.
- News and gaps. A single announcement or weekend gap can jump past your stop, and the loss can exceed what you planned.
- Leverage. Leverage magnifies losses as well as gains, and losing trades on a leveraged account can use up deposited capital quickly.
- Overtrading. With so many possible zones and sweeps, it’s easy to take marginal setups out of boredom or fear of missing out.
- Backtest bias. Marking setups on past charts overstates how clean they’d have been live, because the rules are subjective.
Who SMC Suits, and a Demo-First Way to Start
SMC suits traders who like structured, chart-only analysis, are comfortable with detailed work on higher timeframes, and will journal every setup with written invalidation. It’s a harder fit for anyone who needs objective, automatable rules (zone marking is subjective), who gets frustrated when limit orders don’t fill, or who treats the framework as a guarantee because an educator’s examples look clean. Those examples are usually chosen after the fact.
If you decide to try it, add one piece at a time:
- Spend a couple of weeks on structure only: mark swings, breaks of structure, and changes of character on daily and 1-hour charts.
- Add liquidity: equal highs and lows, and sweeps.
- Add zones last, with written rules for what qualifies.
- Forward-test on a demo account, one pair, and log every setup, including the ones you skipped.
Is SMC Legit? Answers to the Doubts Beginners Raise
Is Smart Money Concept a proven strategy?
No. SMC is a framework for reading price, and its core claim, that institutions deliberately move price to collect liquidity, can’t be verified by retail traders. Some traders report using it consistently, but claims vary and independent testing is limited. Treat it as an idea to test on a demo account with fixed risk rules, not an established method.
Do banks really hunt stop losses?
Large players do need liquidity to fill big orders, and stop orders do cluster at obvious levels. Whether specific moves are intentional stop hunts can’t be confirmed from a chart. Price also overshoots levels for ordinary reasons such as news, thin liquidity, or momentum. A sweep may be a clue, but it isn’t proof of intent.
What’s the difference between SMC and ICT?
SMC is a broader label for chart-reading ideas such as structure, liquidity, order blocks, and fair value gaps. ICT is a specific body of teaching that many of these terms are associated with, and it adds time-based concepts. Definitions differ between teachers, so check which rules a source uses before combining material.
Is SMC just support and resistance with new names?
They overlap, since both mark areas where price reacted before. Classic support and resistance zones come from repeated touches, while order blocks come from a single candle before a structure break, and SMC adds liquidity and imbalance concepts. In practice the labels often overlap, so judge each zone by how price behaves around it.
Can beginners use SMC, and on what timeframe?
Beginners can learn it, but starting with structure on higher timeframes like the 4-hour or daily is more manageable, since noise is lower and setups are fewer. Add one concept at a time and practice each on a demo account. Lower timeframes produce more zones and more false signals, which can overwhelm a new trader.
A Vocabulary for Reading Price, Not a Map of Institutions
SMC gives you a precise vocabulary (structure, liquidity, zones, imbalance) for describing what price just did. It doesn’t give you proof of who moved the market or why. For your next step, open a daily chart and mark ten swing points, then note every break of structure and change of character. Count how many were ambiguous. That number will tell you more about the framework’s usability than any polished example.
Disclaimer
This article is for educational purposes only and is not financial advice. Forex and CFD trading involves a high level of risk, and you can lose some or all of your capital. Leverage can magnify both gains and losses. Never trade with money you can’t afford to lose.
This is a trading framework, not a guarantee. No strategy wins every trade, and results vary with market conditions, execution, and risk management.
Some Smart Money Concept and ICT ideas are debated among traders. Treat them as a framework to test on a demo account, not as established fact.
Any percentages or figures shown are historical averages or hypothetical examples, not guarantees. Past performance does not predict future results.
Join now

Comments (0)
Be the first to comment.