
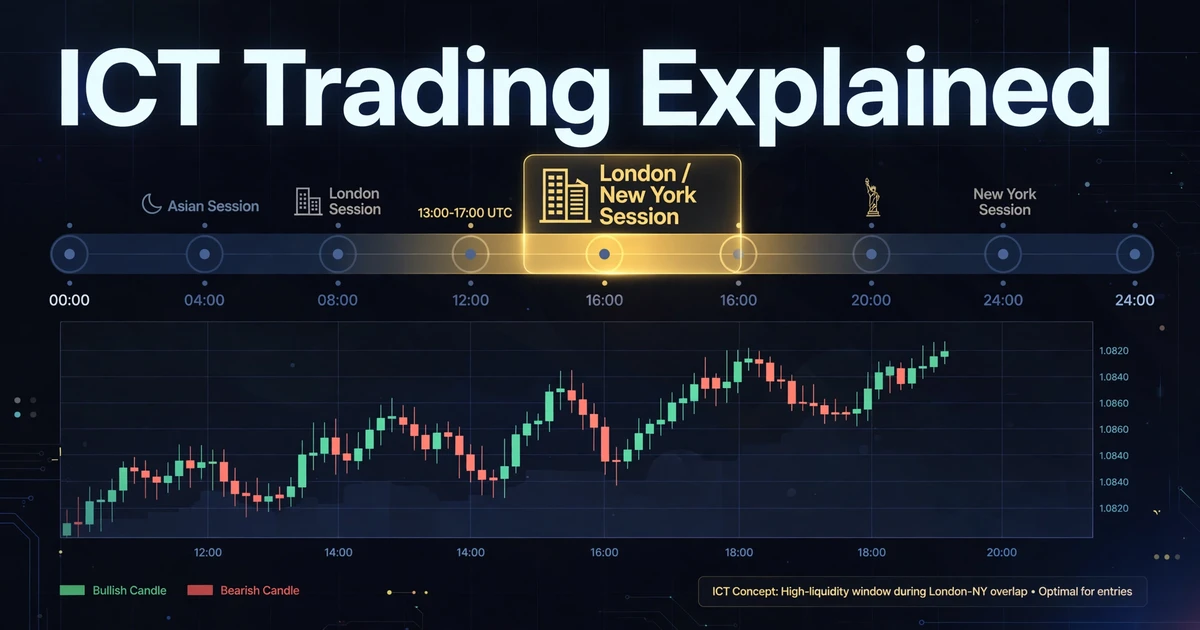
What Is ICT Trading? Inner Circle Trader Concepts Explained
Open any trading forum on a busy morning and you’ll find posts full of words like “Judas swing,” “kill zone,” and “OTE.” Most of them trace back to one source: ICT, short for Inner Circle Trader, a body of free online teaching that has shaped how many retail traders talk about charts. ICT trading blends liquidity, time of day, and specific entry zones into one framework. It’s also contested, so this overview defines the terms, walks through a hypothetical trade, and lays out the criticisms before you spend weeks learning the vocabulary.
ICT in Plain Words: Liquidity, Timing, and Entry Zones
- ICT stands for Inner Circle Trader, the name of an educator whose free lessons popularized a set of price-action concepts.
- The core idea is that price is drawn toward pools of resting orders (liquidity), and that certain hours of the trading day, called kill zones, are the moments worth watching.
- Entries rely on zones such as fair value gaps, order blocks, and a 62% to 79% retracement area called optimal trade entry (OTE).
- It’s a debated framework, not established fact. Treat it as something to test on a demo account.
Where ICT Came From and Why the Name Stuck
ICT is the name used by educator Michael J. Huddleston, who has published a large library of free videos and lessons about reading price. The name stuck because the material introduced a distinctive vocabulary, and much of that vocabulary spread well beyond its original audience into countless chart breakdowns by other traders.
Two things are worth knowing up front. First, there’s no single standardized ICT rulebook. Teachers, students, and social media accounts interpret the material differently, and the same term can mean slightly different things in different places. Second, this article summarizes widely shared concepts in our own words, as a way to understand the vocabulary. It isn’t a substitute for the original lessons, and nothing here endorses any particular course or claim.
How ICT Overlaps With SMC, and What It Adds
Many ICT terms appear in discussions of Smart Money Concept, and the two labels are often used as if they were interchangeable. A rough way to separate them: SMC is a broad community label for reading structure, liquidity, and imbalance. ICT is the teaching source many of those terms are traced to, and it puts extra weight on the clock and on specific entry models.
The shared ground includes swing structure, liquidity sweeps, fair value gaps, and order blocks. What ICT layers on top includes kill zones, a daily Power of 3 model, and the OTE retracement. Our SMC guide covers the shared foundation, so the rest of this article concentrates on the extras.
Liquidity Targets ICT Traders Mark Each Day
In ICT language, liquidity means clusters of resting orders, mostly stop-losses and breakout entries, that sit above obvious highs and below obvious lows. Buy-side liquidity sits above highs, and sell-side liquidity sits below lows. The levels traders mark most often are:
- The previous day’s high and low
- The previous week’s high and low
- The Asian session range high and low
- Equal highs or equal lows, where price touched nearly the same level two or more times
- Recent session highs and lows
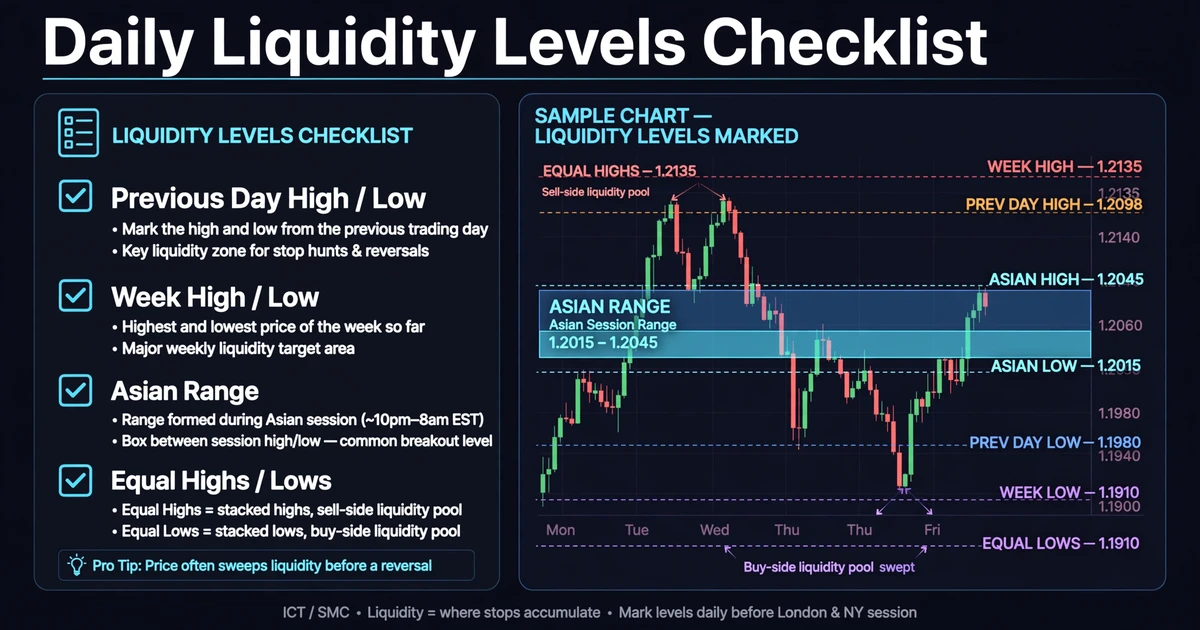
Traders build a daily bias around these levels. The question is which pool price is likely to be “drawn” toward, and which pool might get swept first. A bullish bias, for example, might mean expecting a quick sweep of the Asian low before a rally toward the previous day’s high.
Treat bias as a hypothesis, not a forecast. It tells you which setups to look for and which to ignore. It doesn’t tell you what the market will do.
Fair Value Gaps, Order Blocks, and Breaker Blocks
Fair value gap
A fair value gap (FVG) is a three-candle pattern where the wicks of the first and third candles don’t overlap, leaving a visible gap created by a fast move. ICT traders watch it as an area price may revisit.
Order block
An order block is typically the last opposite-colored candle before a strong move that breaks structure. The last down candle before a sharp rally is a bullish order block.
Breaker block
A breaker block is an order block that fails. If price closes decisively through a bullish order block, some traders flip its role and watch it as resistance on the retest. The logic is that trapped traders may exit there. Like most terms in this framework, it’s a hypothesis worth testing, not a rule that prices obey.
Kill Zones: Why ICT Cares About the Clock
A kill zone is a window of the trading day when ICT traders expect cleaner moves, usually because volatility and participation rise when major financial centers open. It’s a reasonable idea. Liquidity and volatility do tend to rise around the London open and the overlap with New York, a pattern covered in our guide to the four major forex sessions.
Teachers define the exact windows differently. These are commonly cited ones, in New York time:
| Window | Typical New York time | What ICT traders watch for |
|---|---|---|
| Asian range | 8:00 p.m. to midnight | Price consolidates, and the range high and low become liquidity targets |
| London kill zone | 2:00 a.m. to 5:00 a.m. | A first sweep of the Asian range and an early directional move |
| New York AM kill zone | 7:00 a.m. to 10:00 a.m. | Reaction to US data and the New York open, either continuation or reversal |
| London close | 10:00 a.m. to noon | Retracements as European traders square positions |
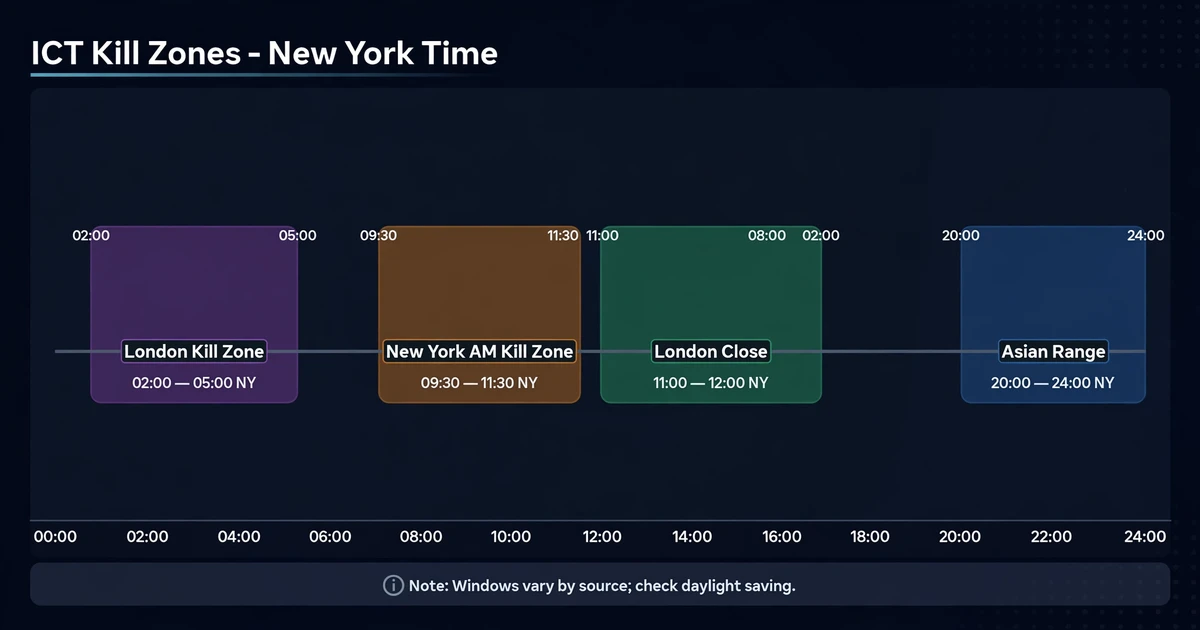
Clock details matter here. New York time follows daylight saving (UTC−5 in winter, UTC−4 in summer). Because the US and UK change their clocks on different dates in spring and autumn, the gap between London and New York shifts by an hour for a few weeks each year. If you trade these windows, confirm your platform’s server time and convert carefully, or your “London open” setup will be an hour off.
The Power of 3: Accumulation, Manipulation, Distribution
One of ICT’s best-known ideas is a three-phase model of the trading day, often called Power of 3 or AMD:
- Accumulation. Price consolidates in a range, often during the Asian session.
- Manipulation. Price makes a false move, usually at the London open, that sweeps liquidity on one side of the range. This is sometimes called a Judas swing.
- Distribution. Price reverses and travels in the direction the day “really” wanted to go.
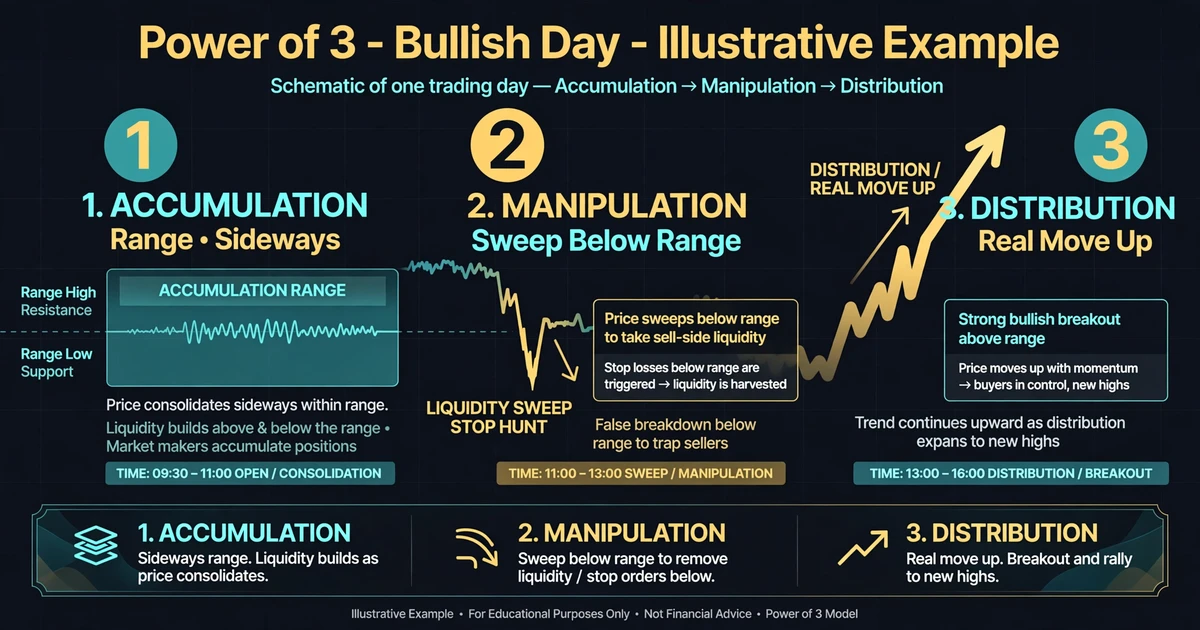
On a bullish day, that means a quick drop below the Asian low followed by a rally. On a bearish day, it’s a spike above the Asian high followed by a decline.
The model is tidy on selected charts. On many days it won’t appear at all: price may break out of the range and keep going, chop sideways, or reverse twice. Count how often the pattern shows up on your pair before building a plan around it.
Optimal Trade Entry: The 62% to 79% Retracement Zone
Optimal trade entry (OTE) is ICT’s entry zone. After a strong move in your bias direction, price often retraces part of it, and OTE is the area between the 62% and 79% retracement of that move, with 70.5% as the midpoint. It’s drawn with the same tool covered in our guide to Fibonacci retracement in forex, with levels set to the ICT convention.
Say the swing runs from 0.5980 up to 0.6080, a 100-pip leg. The OTE zone is then:
- 62% retracement: 0.6080 − 0.0062 = 0.6018
- 70.5% retracement: 0.6080 − 0.00705 = 0.60095
- 79% retracement: 0.6080 − 0.0079 = 0.6001
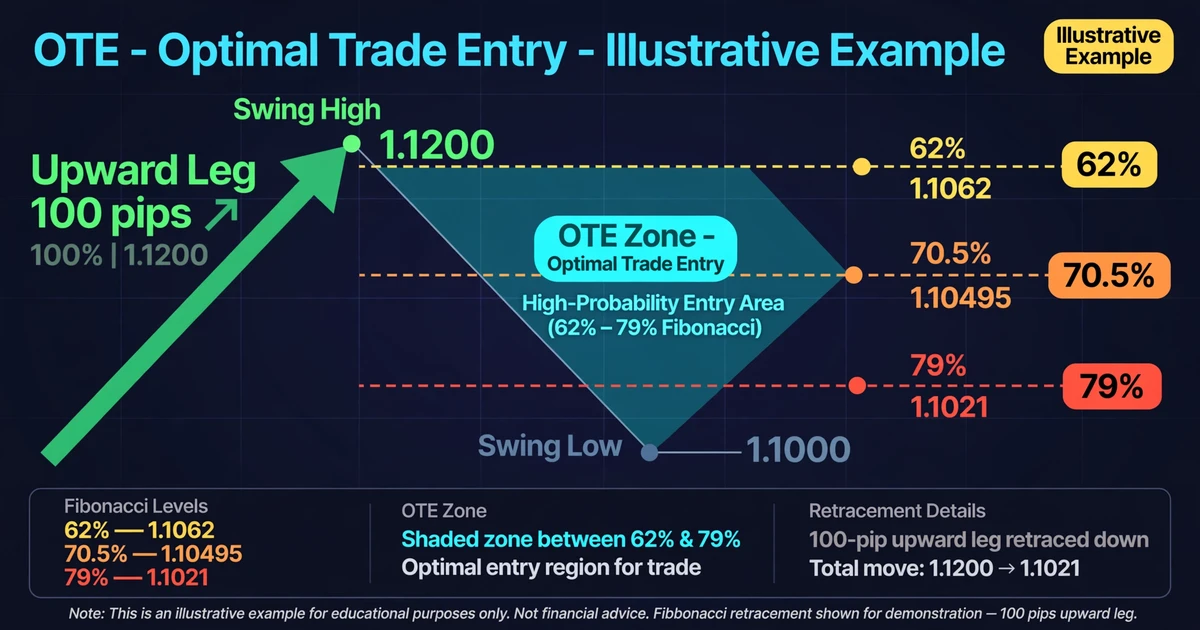
The practical question is how to define the leg. Measuring from the sweep low to the swing high produces different levels than measuring from the Asian low, so write the rule down before you draw.
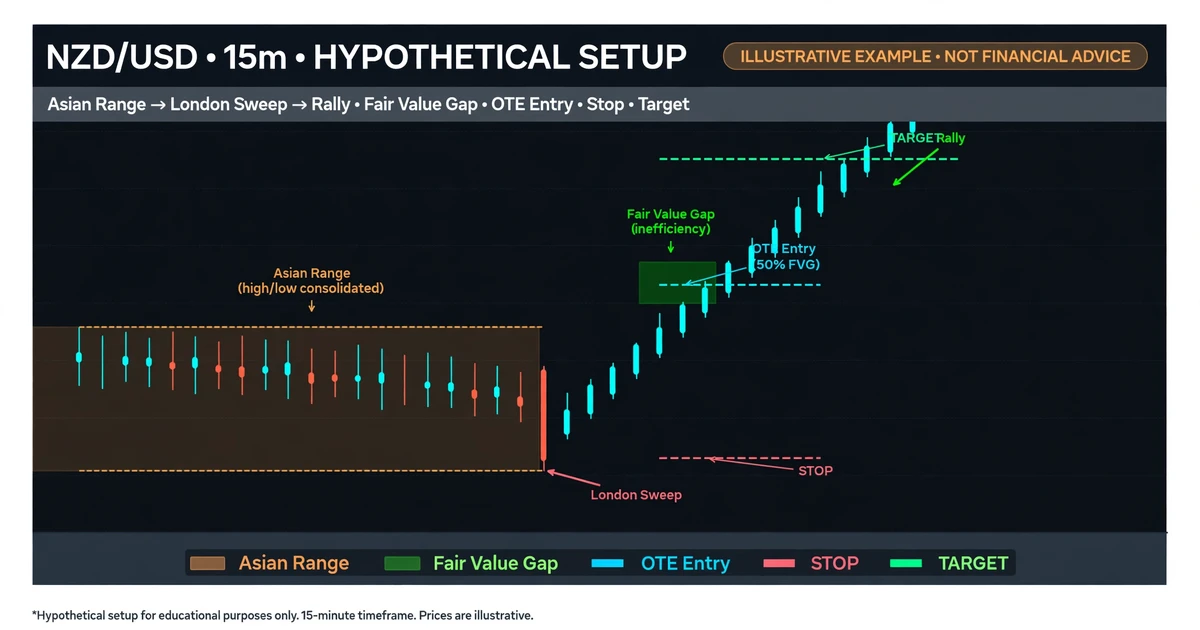
Asian Range, London Sweep, OTE Entry: One NZD/USD Morning
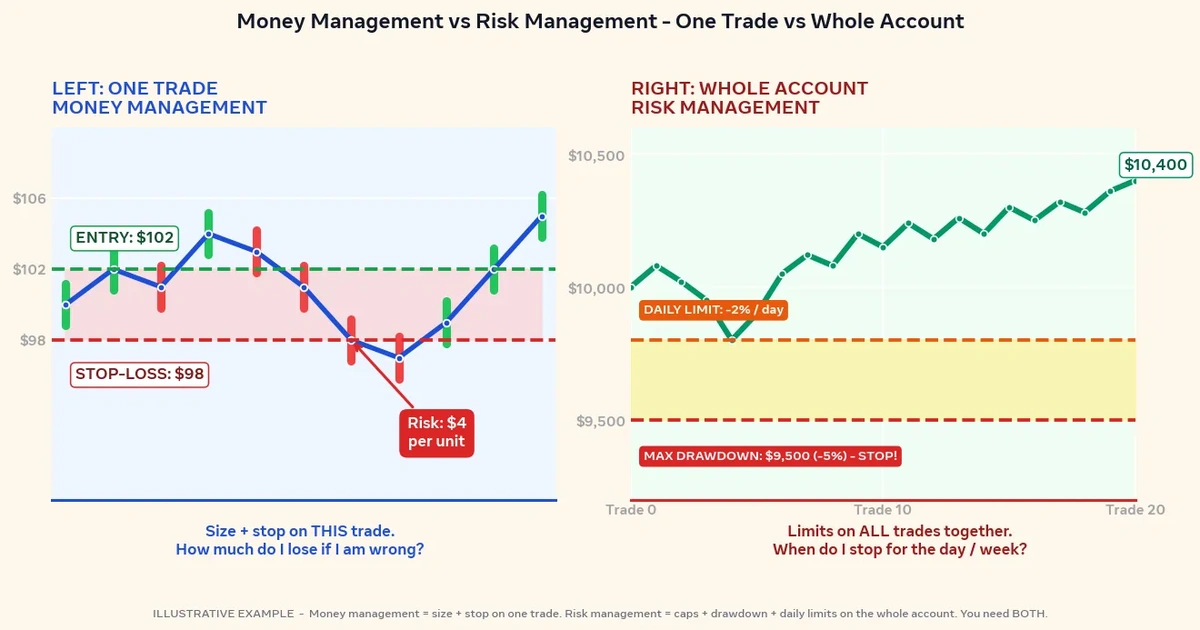
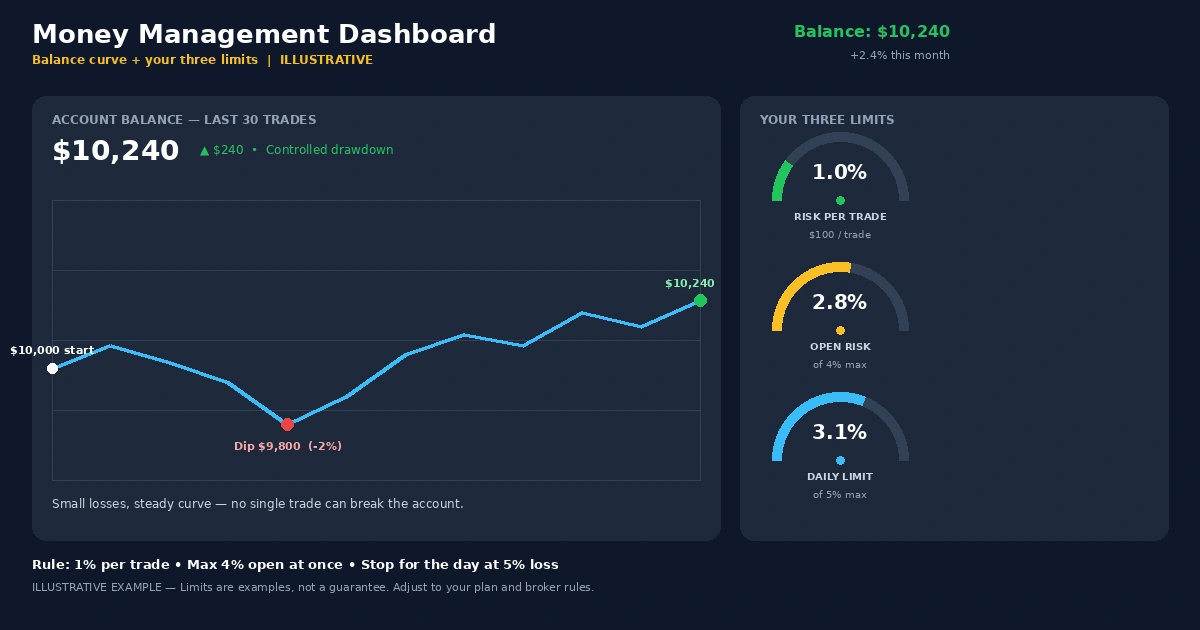
Here’s how the pieces could fit together in a single session. Times are New York time. The trader has an $8,000 USD account and risks 0.5% ($40) per trade.
- Before the session: Higher-timeframe structure is bullish, so the bias is long. Price is expected to draw toward the previous day’s high at 0.6115.
- 8:00 p.m. to midnight: The Asian range forms, with a low of 0.5990 and a high of 0.6010.
- 3:10 a.m. (London kill zone): Price drops to 0.5980, sweeping the Asian low by 10 pips, then closes back inside the range.
- 4:30 a.m.: Price rallies to 0.6080, a 100-pip leg from the sweep low, and leaves a fair value gap on the way up.
- The plan: A buy limit at 0.6010, near the 70.5% OTE level and the top of the Asian range. The stop goes at 0.5975, five pips below the sweep low, for 35 pips of risk. The target is the previous day’s high at 0.6115, which is 105 pips of reward, or 3:1.
This is a hypothetical example for illustration only.
For sizing, a pip on NZD/USD is worth $10 per standard lot in a USD account. Position size is $40 ÷ (35 pips × $10) = 0.114 lots, rounded down to 0.11 lots. Actual risk is 0.11 × 35 × $10 = $38.50, and the gain at the target would be 0.11 × 10⁵ × $10 = $115.50. A one-pip spread costs about $1.10 at that size.
The plan also includes a time rule. If the order hasn’t filled by 10:00 a.m., the trader cancels it, because the idea has gone stale. And the idea can fail in several ways: price may rally without ever pulling back to 0.6010, or it may drop through 0.5975 on a second sweep and stop out the trade.
The Skeptic’s File on ICT
Plenty of experienced traders push back on this material, and the objections deserve a fair hearing:
- The premise can’t be verified. Spot forex is decentralized, and retail traders can’t see institutional order flow. “Manipulation” and “smart money” intent are interpretations of candles, not observations.
- Definitions drift. Because different teachers define kill zones, order blocks, and OTE differently, it’s hard to say what exactly is being tested, and a loose framework can explain almost any outcome.
- Hindsight makes charts look clean. Sweeps, gaps, and blocks are obvious after the move. In real time, the same candles are ambiguous.
- Examples are selected. Social media breakdowns show the setups that worked, and the ones that failed rarely get posted.
- Independent testing is thin. Rigorous, public tests of specific ICT rules are limited, so most claims come from educators and individual traders.
Supporters reply that ICT is a way of structuring a chart read, not a claim to know institutional orders, and that its real discipline is the clock, defined levels, and a stop placed before entry. That’s a fair defense of the method as a process. It doesn’t prove the process produces an edge, which is something only your own forward testing can show.
Vocabulary Overload and Other Early Detours
- Learning advanced models before structure. Silver bullet windows and market maker models make little sense if you can’t yet mark swing highs and lows consistently.
- Trading outside the kill zones because a setup “looked like” the examples. The timing is a core part of the framework.
- Ignoring time zones and daylight saving, so a “London open” entry is placed an hour early or late.
- Drawing OTE from different swing points each time until a level lines up with your hoped-for entry.
- Treating daily bias as certainty. A bias is a starting hypothesis, and it needs an exit plan for when it’s wrong.
- Taking several setups in one window and ending up with correlated, oversized risk.
- Copying a creator’s entries without knowing where the idea is invalidated.
Kill Zone Volatility, Limit Orders, and Leverage: The Costs of an ICT Approach
- Volatility at the opens. The windows ICT traders favor are also when spreads can widen and prices can jump, so slippage on stops is more likely.
- News overlap. Scheduled releases often land inside the New York kill zone, and a single headline can run through a stop and cause a loss larger than planned.
- Unfilled orders. Limit entries at OTE may never trigger if price moves away, and you can miss the trade entirely.
- Wide stops. Stops placed beyond sweep lows or highs can be long. Keeping dollar risk fixed then means smaller positions, so costs take a bigger share of the potential gain.
- Leverage. Leverage magnifies losses as well as gains, and a run of losing trades can use up deposited capital quickly. Our forex risk management guide covers position sizing and loss limits in depth.
- Screen time and fatigue. Depending on your time zone, the London window may fall in the middle of the night, and tired decisions tend to be worse ones.
- Overtrading and backtest bias. With many possible zones, it’s tempting to take marginal setups, and marking setups on past charts overstates how clean they’d have been live.
Is This Your Kind of Trading? Hours, Patience, and a Learning Order
ICT-style trading tends to suit traders whose schedule lines up with the kill zones, who are comfortable with discretionary chart reading, and who will journal every setup with written invalidation. It’s a harder fit if your hours are unpredictable, if you want fully mechanical rules, or if you’d treat a framework as a guarantee.
If you decide to explore it, add one layer at a time:
- Mark swing structure on daily and 1-hour charts until you can do it consistently.
- Add the daily levels (previous day high and low, Asian range) and note how price reacts to them.
- Add the sessions and watch only the kill zones for a few weeks, without trading.
- Add fair value gaps, order blocks, and OTE, with written rules for each.
- Forward-test on a demo account, on one pair, logging every setup including the ones you skipped.
ICT Doubts, Answered Without the Hype
Is ICT the same as Smart Money Concept?
Not exactly. SMC is a broad label for reading structure, liquidity, and imbalance, while ICT is the teaching source many of those terms are traced to. ICT also adds its own elements, such as kill zones, the Power of 3 model, and OTE. The two overlap heavily, and different teachers define terms differently.
Does ICT trading actually work?
There’s no reliable public evidence that it works for traders in general. Some traders report using it consistently, but individual claims vary and are hard to verify. Outcomes depend on execution, risk control, and market conditions. The sensible approach is to test the specific rules you plan to use on a demo account before risking real money.
What time are the ICT kill zones?
Commonly cited windows, in New York time, are roughly 2:00 to 5:00 a.m. for London and 7:00 to 10:00 a.m. for New York. Sources differ, and the times shift relative to your own clock with daylight saving changes. Confirm your platform’s server time and convert carefully before trading any window.
Can ICT concepts be used on any pair?
The concepts are applied to many markets, but session-based timing makes more sense on pairs that trade actively in the sessions you’re watching, such as those involving the dollar, euro, or pound. Thinly traded pairs can have wider spreads and erratic moves. Test any pair you plan to trade rather than assuming the behavior carries over.
Can a beginner learn ICT, and where should they start?
Yes, but the vocabulary is large and can overwhelm new traders. Start with swing structure and the main sessions, then add liquidity levels, and only later add zones and OTE. Practice each step on a demo account before moving on, and expect the learning process to take months rather than weeks.
A Clock, a Level, and a Reason to Be Wrong
Strip away the jargon and ICT asks three things of you: know where the obvious liquidity sits, watch the hours when price tends to move, and define where your idea fails before you enter. Whether the framework adds an edge is for your own testing to show. Tomorrow morning, before the London session opens, mark the Asian range and the previous day’s high and low, then note what price does around them. Before sizing any trade like that, read our guide to forex risk management.
Disclaimer
This article is for educational purposes only and is not financial advice. Forex and CFD trading involves a high level of risk, and you can lose some or all of your capital. Leverage can magnify both gains and losses. Never trade with money you can’t afford to lose.
This is a trading framework, not a guarantee. No strategy wins every trade, and results vary with market conditions, execution, and risk management.
Some Smart Money Concept and ICT ideas are debated among traders. Treat them as a framework to test on a demo account, not as established fact.
Any percentages or figures shown are historical averages or hypothetical examples, not guarantees. Past performance does not predict future results.
Join now
Comments (0)
Be the first to comment.