Daily Range (ADR): Average Daily Range Indicator for MT5
- Instant Download
- Lifetime Access
- Free Updates
- 24/7 Support
Code: IN14574
By mid-session, many traders ask the same thing: has price already done most of what it usually does today? A chart alone doesn’t answer that. Daily Range (ADR) is an average daily range indicator for MT5. It compares how far a symbol has moved today with its recent daily average, and shows the result in a panel on your chart.
Four Numbers That Compare Today’s Move With the Recent Average
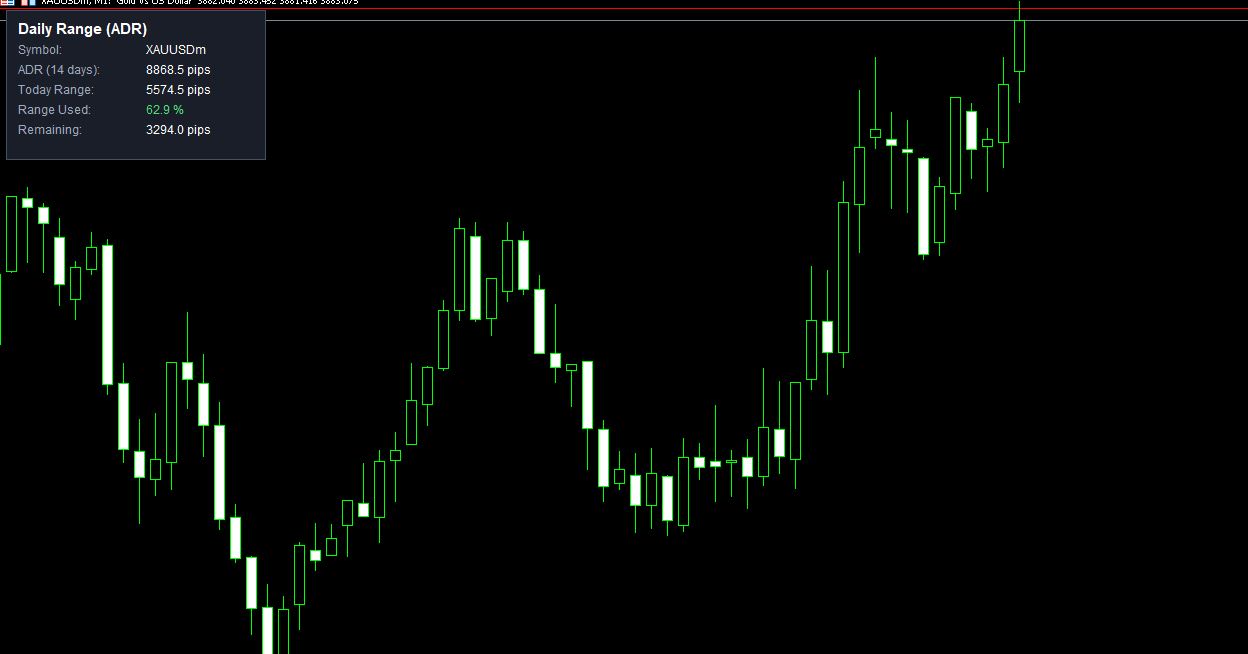
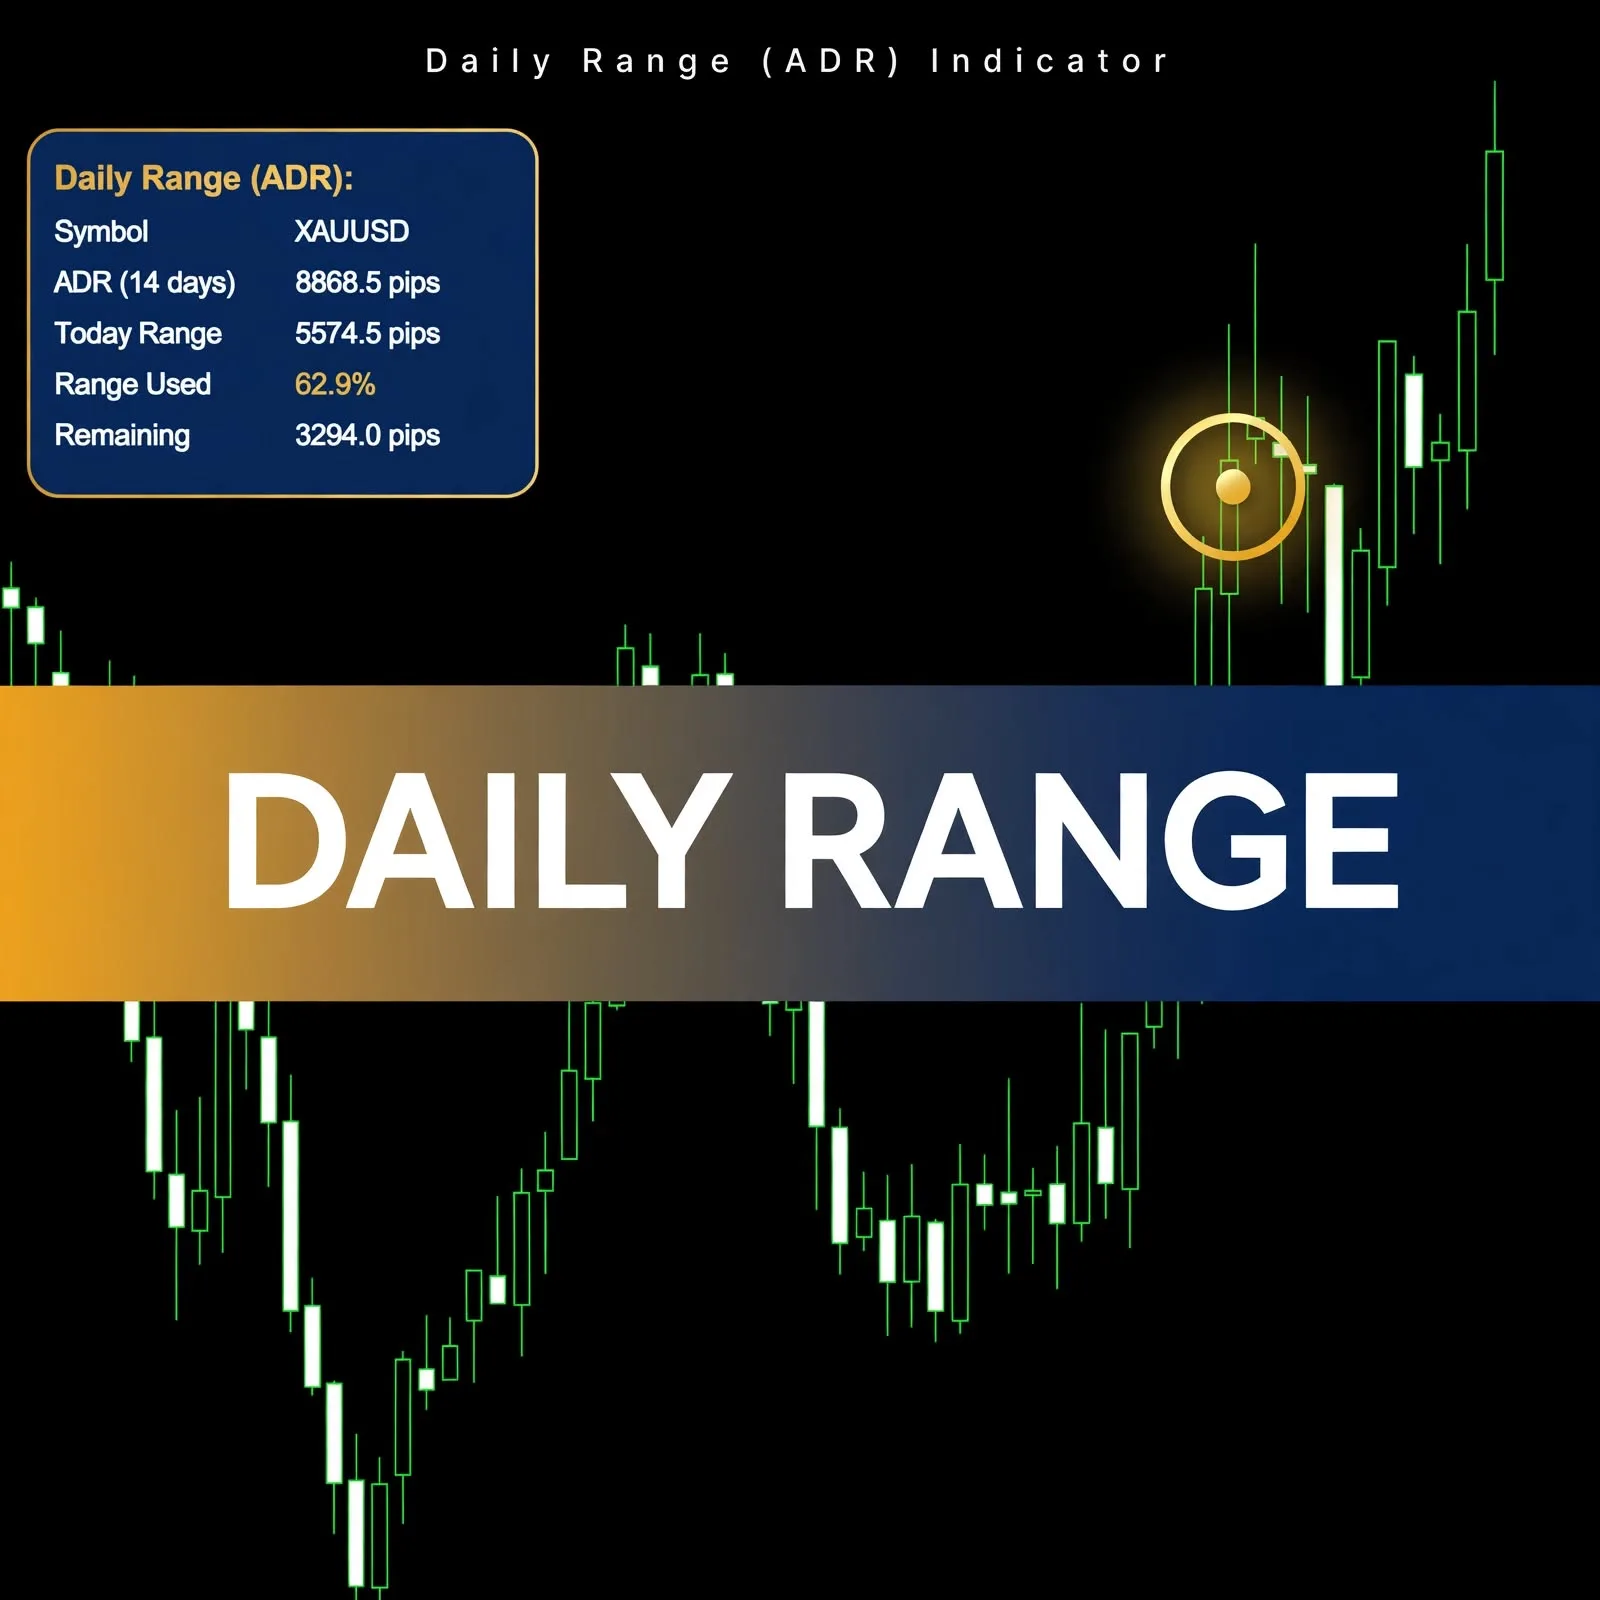
The panel in the product screenshot shows five lines:
| Panel line | Example shown |
|---|---|
| Symbol | XAUUSDm |
| ADR (14 days) | 8868.5 pips |
| Today Range | 5574.5 pips |
| Range Used | 62.9 % |
| Remaining | 3294.0 pips |
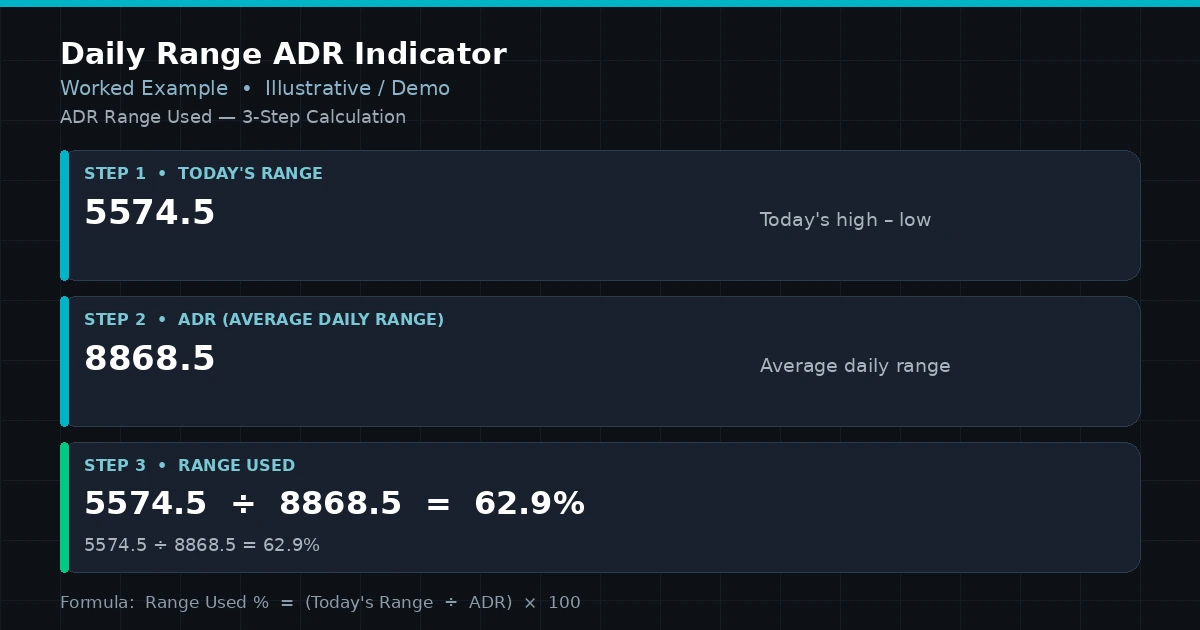
The Range Used line is highlighted in green. The figures relate to each other in a simple way. In the example, 5574.5 ÷ 8868.5 gives about 62.9 %, and 8868.5 − 5574.5 leaves 3294.0 pips. You can follow the arithmetic yourself, which makes the panel easy to trust and to sanity-check.
The One Setting: ADR Period in Days
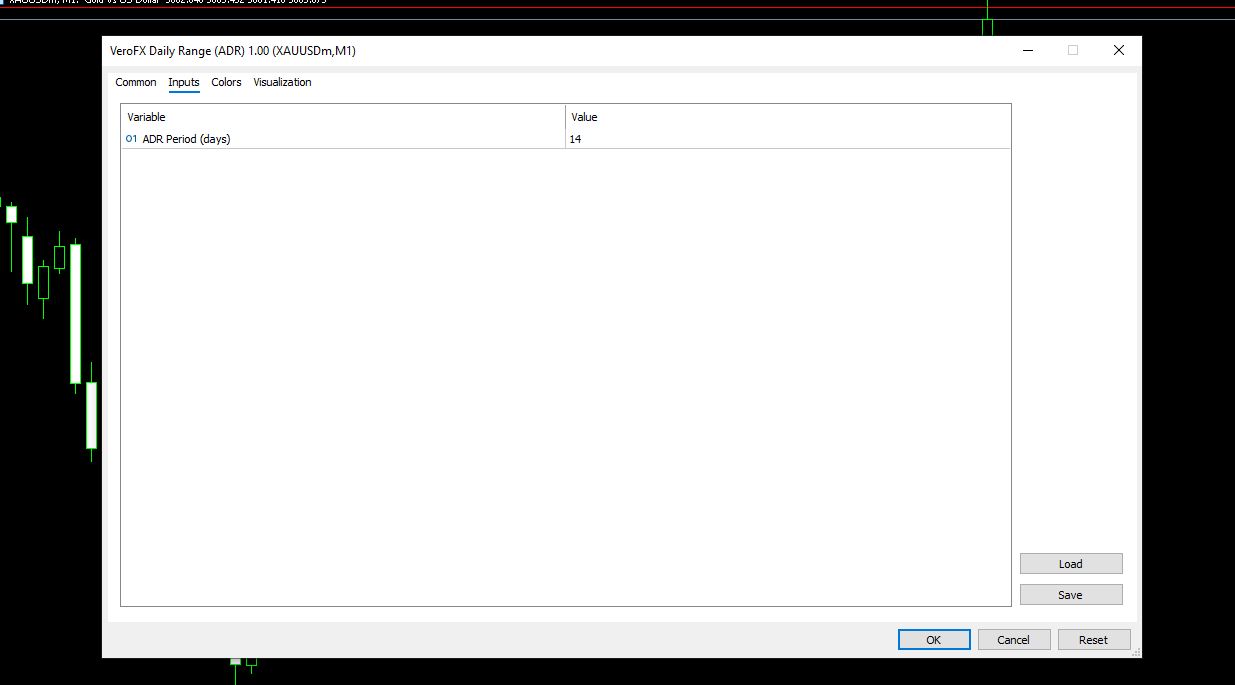
The Inputs tab contains a single setting, ADR Period (days), shown at 14. It sets how many past days are averaged to produce the ADR figure. A shorter period follows recent volatility more closely, while a longer one smooths it out. The panel label updates the day count, so it reads “ADR (14 days)” at the default. The settings window also includes Common, Colors, and Visualization tabs.
How Average Daily Range, Range Used, and Remaining Fit Together
Average daily range is the mean distance between the high and low of each day over a chosen number of days. Today’s range is the same measure for the current day so far. The indicator then expresses the second as a share of the first.
That gives you a quick read on:
- How much has already happened today. A reading near 100 % or above means the day has matched or exceeded its recent average.
- How much room is left, in the average sense. Remaining shows the gap between the average and today’s move.
- Context for targets. If a planned target is larger than the remaining range, you can weigh that before entering.
ADR is a reference, not a limit. Days regularly end well short of or well beyond the average.
Putting Daily Range Next to Your Trading Style
Range information matters differently depending on how long you hold. Intraday traders often want to know whether a day is still active, while longer-term traders may use it to judge typical movement. Scalping vs day trading vs swing trading compares how those styles use time and distance.
You can also read the numbers against levels on your chart. If remaining range is small and price is near a significant level, that’s context to weigh, and strong vs weak support and resistance zones covers how to judge such levels.
Tested on a Gold Symbol at M1: What That Does and Doesn’t Tell You
The screenshots were captured on a gold symbol (XAUUSDm) on an M1 chart. The values shown are a snapshot of one moment, not typical readings. Other symbols and timeframes aren’t specified on this page, so test on a demo account with your own instruments. Compatibility may vary by broker and account type.
Before relying on the figures, check what a pip means on your symbol. Brokers can define pip size differently on metals, indices, and forex pairs, so the same movement can appear as a different pip count.
Installing a Daily Range (ADR) .ex5 File in MT5
MT5 indicators are normally installed as .ex5 files. In MT5, choose File > Open Data Folder, then MQL5 > Indicators, and copy the file there. Refresh the Navigator panel (or restart MT5), then drag Daily Range (ADR) onto a chart. Set the ADR period in the settings window if you want something other than 14 days.
A Fit for Traders Who Gauge the Day’s Remaining Movement
Likely a good fit if you:
- Want to see how much of an average day has already been used
- Set targets and want to compare them with typical daily movement
- Trade several symbols whose daily ranges differ widely
Probably not for you if you:
- Expect an indicator to say where price will reverse or stop
- Want entries, exits, or direction from a single tool
- Don’t use daily movement as part of your planning
Where an Average Range Can Give a False Sense of Room
An average describes the past, not the day in front of you:
- Averages hide extremes. One very large day can raise the ADR, which makes ordinary days look as if they have more room left than they do.
- Remaining isn’t a promise. Price can end the day with range left over, or move far past the average, especially around news.
- The day boundary comes from your platform. Today’s range follows your broker’s daily candle, which can start at a different hour from your own trading day.
- No direction. The panel measures distance only, not whether price is likely to rise or fall.
- Pip conventions vary. A symbol’s pip definition affects every figure on the panel.
- The indicator displays information based on historical price data and can mislead if you rely on it alone.
Range information supports planning, but it doesn’t replace risk limits. The forex risk management complete guide covers position size, stops, and daily loss limits.
Questions About the ADR Period, Range Used, and Timeframes
What does Range Used mean?
It’s today’s range as a percentage of the average daily range. In the screenshot, 5574.5 pips against an ADR of 8868.5 pips gives 62.9 %.
Can I change the number of days averaged?
Yes. The ADR Period (days) input is shown at 14, and you can change it. The panel label shows the number you choose.
Does it predict how far price will go today?
No. It compares today’s movement with a historical average. Results vary, and a day can end well short of or well beyond that average.
Which symbols and timeframes does it work on?
The screenshots show a gold symbol on M1. Other symbols and timeframes aren’t specified here, so test on a demo account first. Compatibility may vary by broker and account type.
Disclaimer
This product is provided for educational and analytical purposes only and is not financial advice. Forex and CFD trading involves a high level of risk, and you can lose some or all of your capital. Leverage can magnify both gains and losses. No product can guarantee profits, and results vary. Never trade with money you can’t afford to lose.
Indicators display information based on historical price data and may produce misleading or delayed signals in some market conditions. They should be used as one part of a complete trading plan with proper risk management.
MetaTrader, MT4, and MT5 are trademarks of their respective owners. This product is not affiliated with or endorsed by MetaQuotes Ltd.