Session Levels Indicator for MT5: Asian, London & New York High, Low and Open Lines
- Instant Download
- Lifetime Access
- Free Updates
- 24/7 Support
Code: IN54093
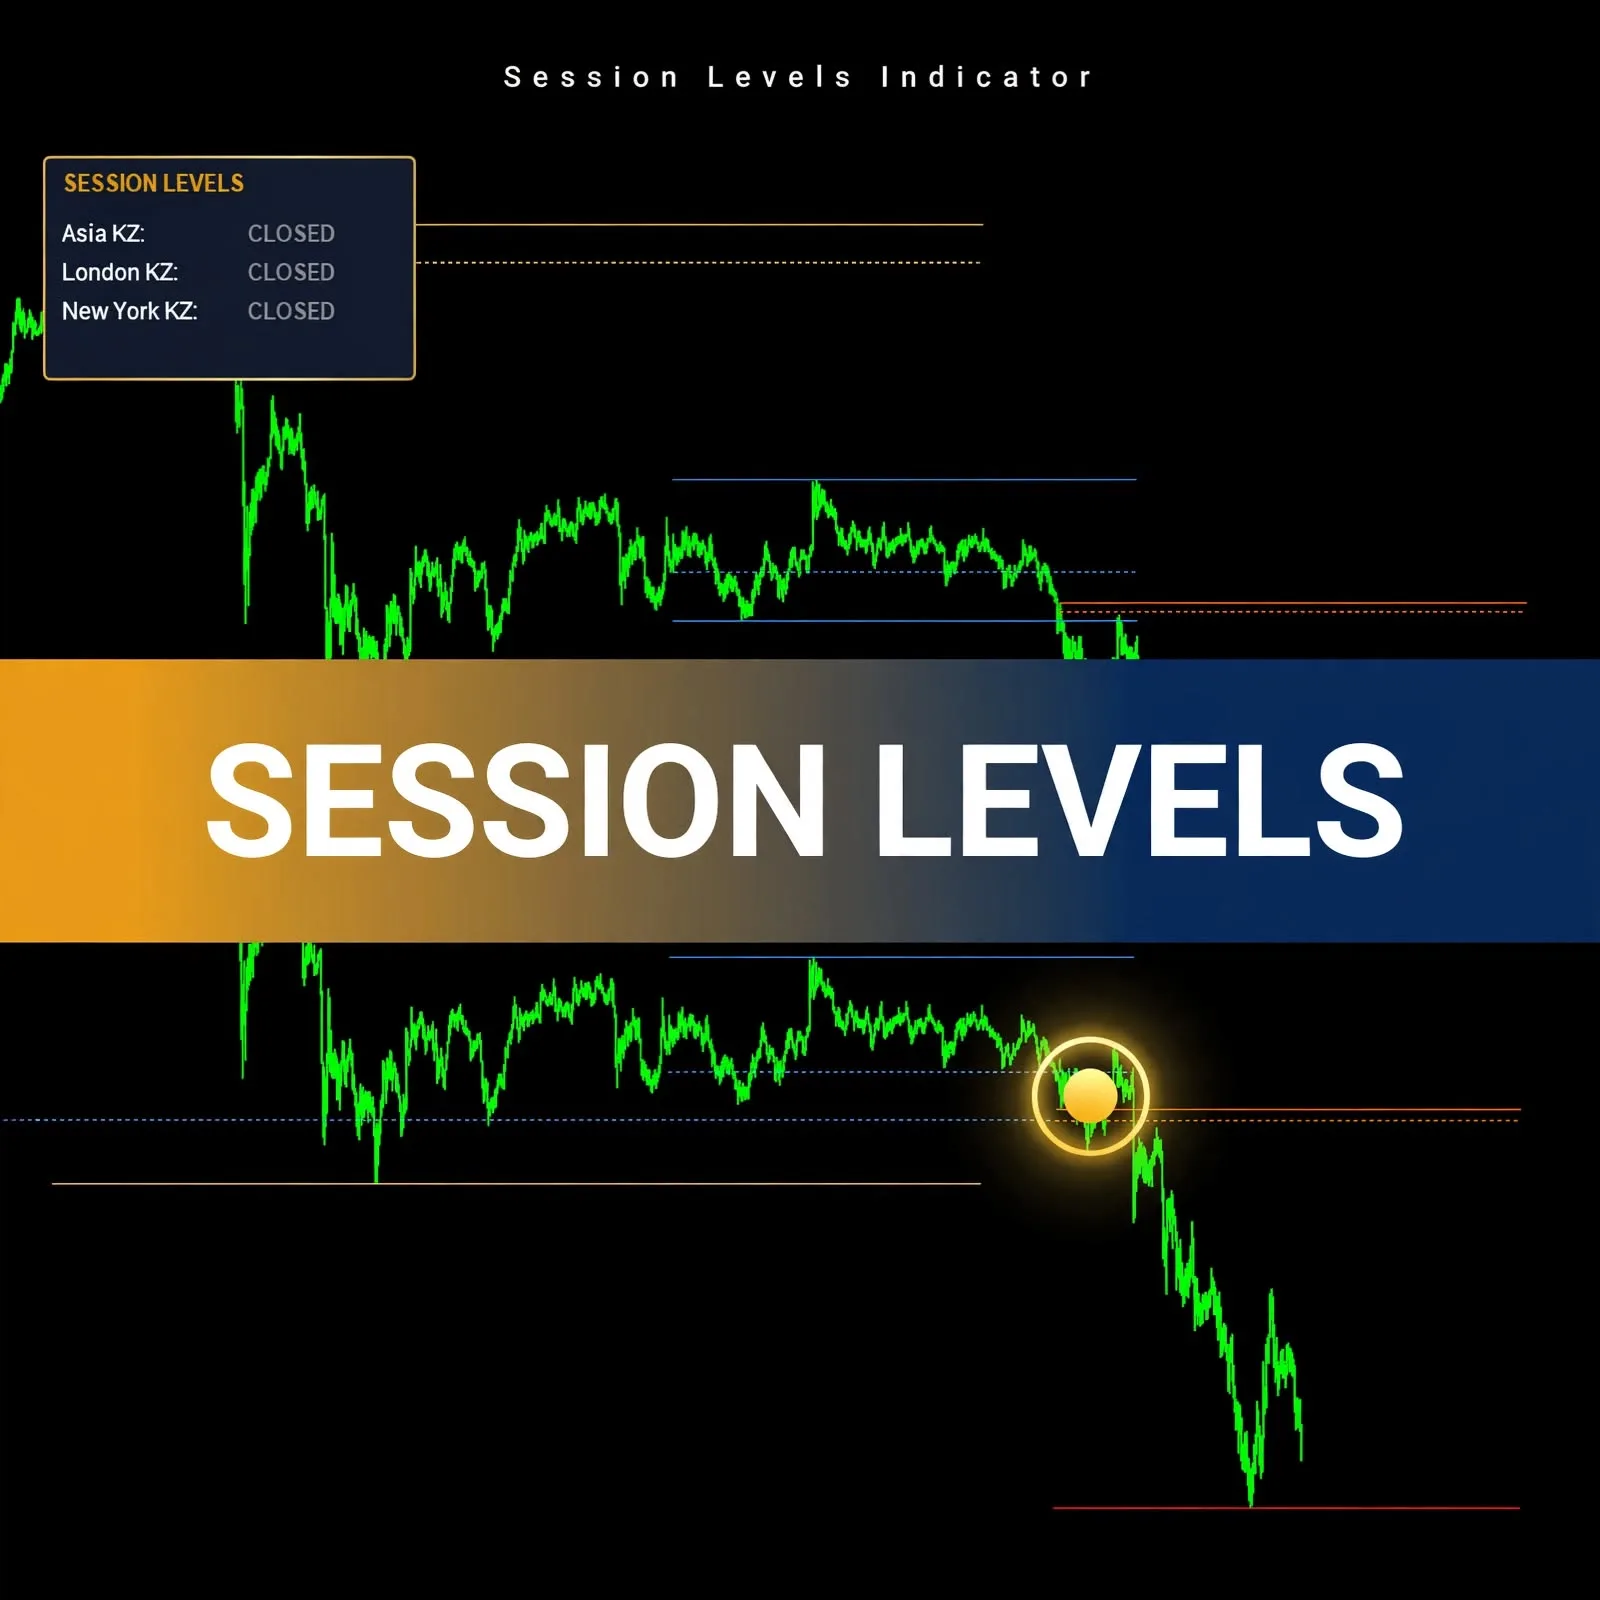
Most traders mark yesterday’s Asian range or this morning’s London high by hand, then redo it every day. This session levels indicator for MT5 does that drawing for you. It plots the high, low and open of the Asian, London and New York windows as horizontal lines, going back as many days as you choose, and a small panel shows which sessions are currently active.
Three Sessions, Three Colors, Up to Three Lines Each
- Asian, London and New York on one chart. Each session has its own on/off switch, so you can show all three or only the one you trade.
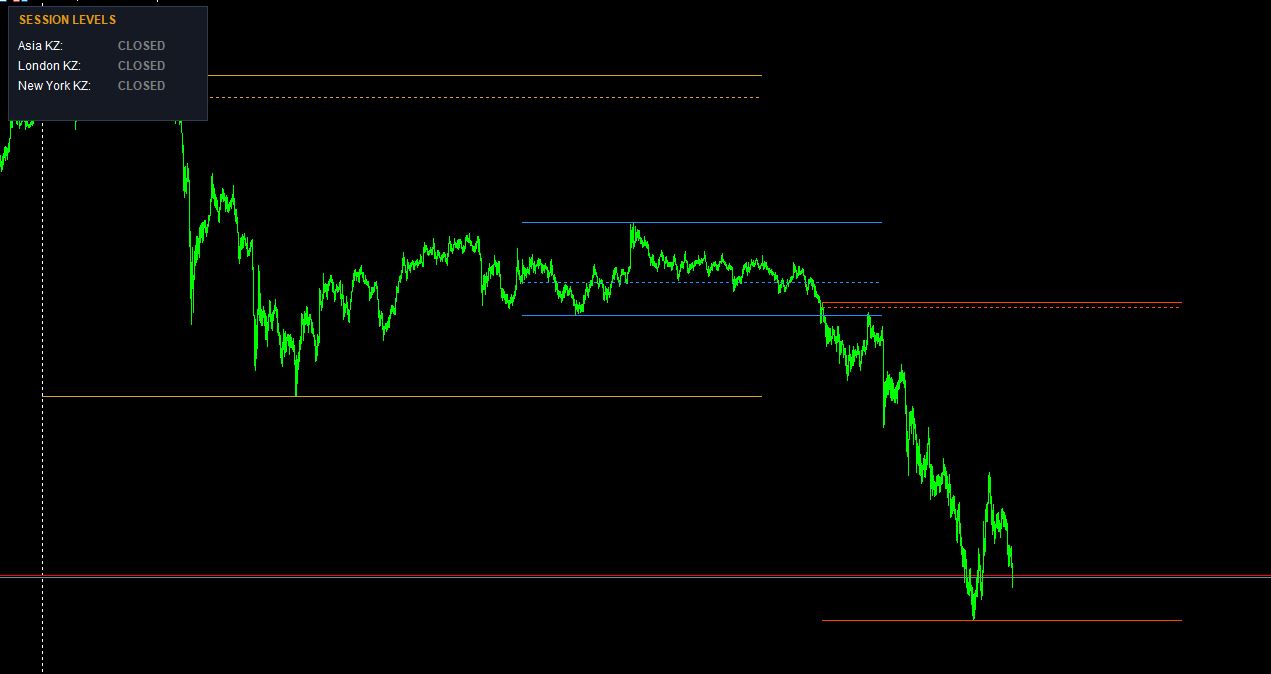
- High and low lines. The highest and lowest prices inside each session window are drawn as horizontal lines that extend past the session’s end for visibility.
- A separate open line. The first price of the session is drawn as a dotted line, so the open is easy to tell apart from the high and low. You can turn it off.
- Color coding by session. Defaults are Goldenrod for Asia, DodgerBlue for London and OrangeRed for New York, and each can be changed.
- Multi-day history. “Days of History to Draw” is set to 10 by default, so earlier sessions stay visible as reference levels.
- Line style choice. High and low lines follow the Line Style input (Solid by default). Open lines are always dotted.
- A clickable VeroFX.com label appears in the lower-right corner of the chart.
Reading the Lines and the ACTIVE / CLOSED Panel
For each day in the lookback range, the indicator finds the bars that fall inside the session’s start and end hours. It then records the highest high, the lowest low and the first bar’s open. The lines are redrawn whenever a new bar forms on your chart.
The panel in the upper-left corner lists “Asia KZ”, “London KZ” and “New York KZ”. Each shows ACTIVE in green when the current server hour falls inside that session’s window, and CLOSED in gray when it does not. The panel refreshes about once a second. Sessions you switch off are removed from it.
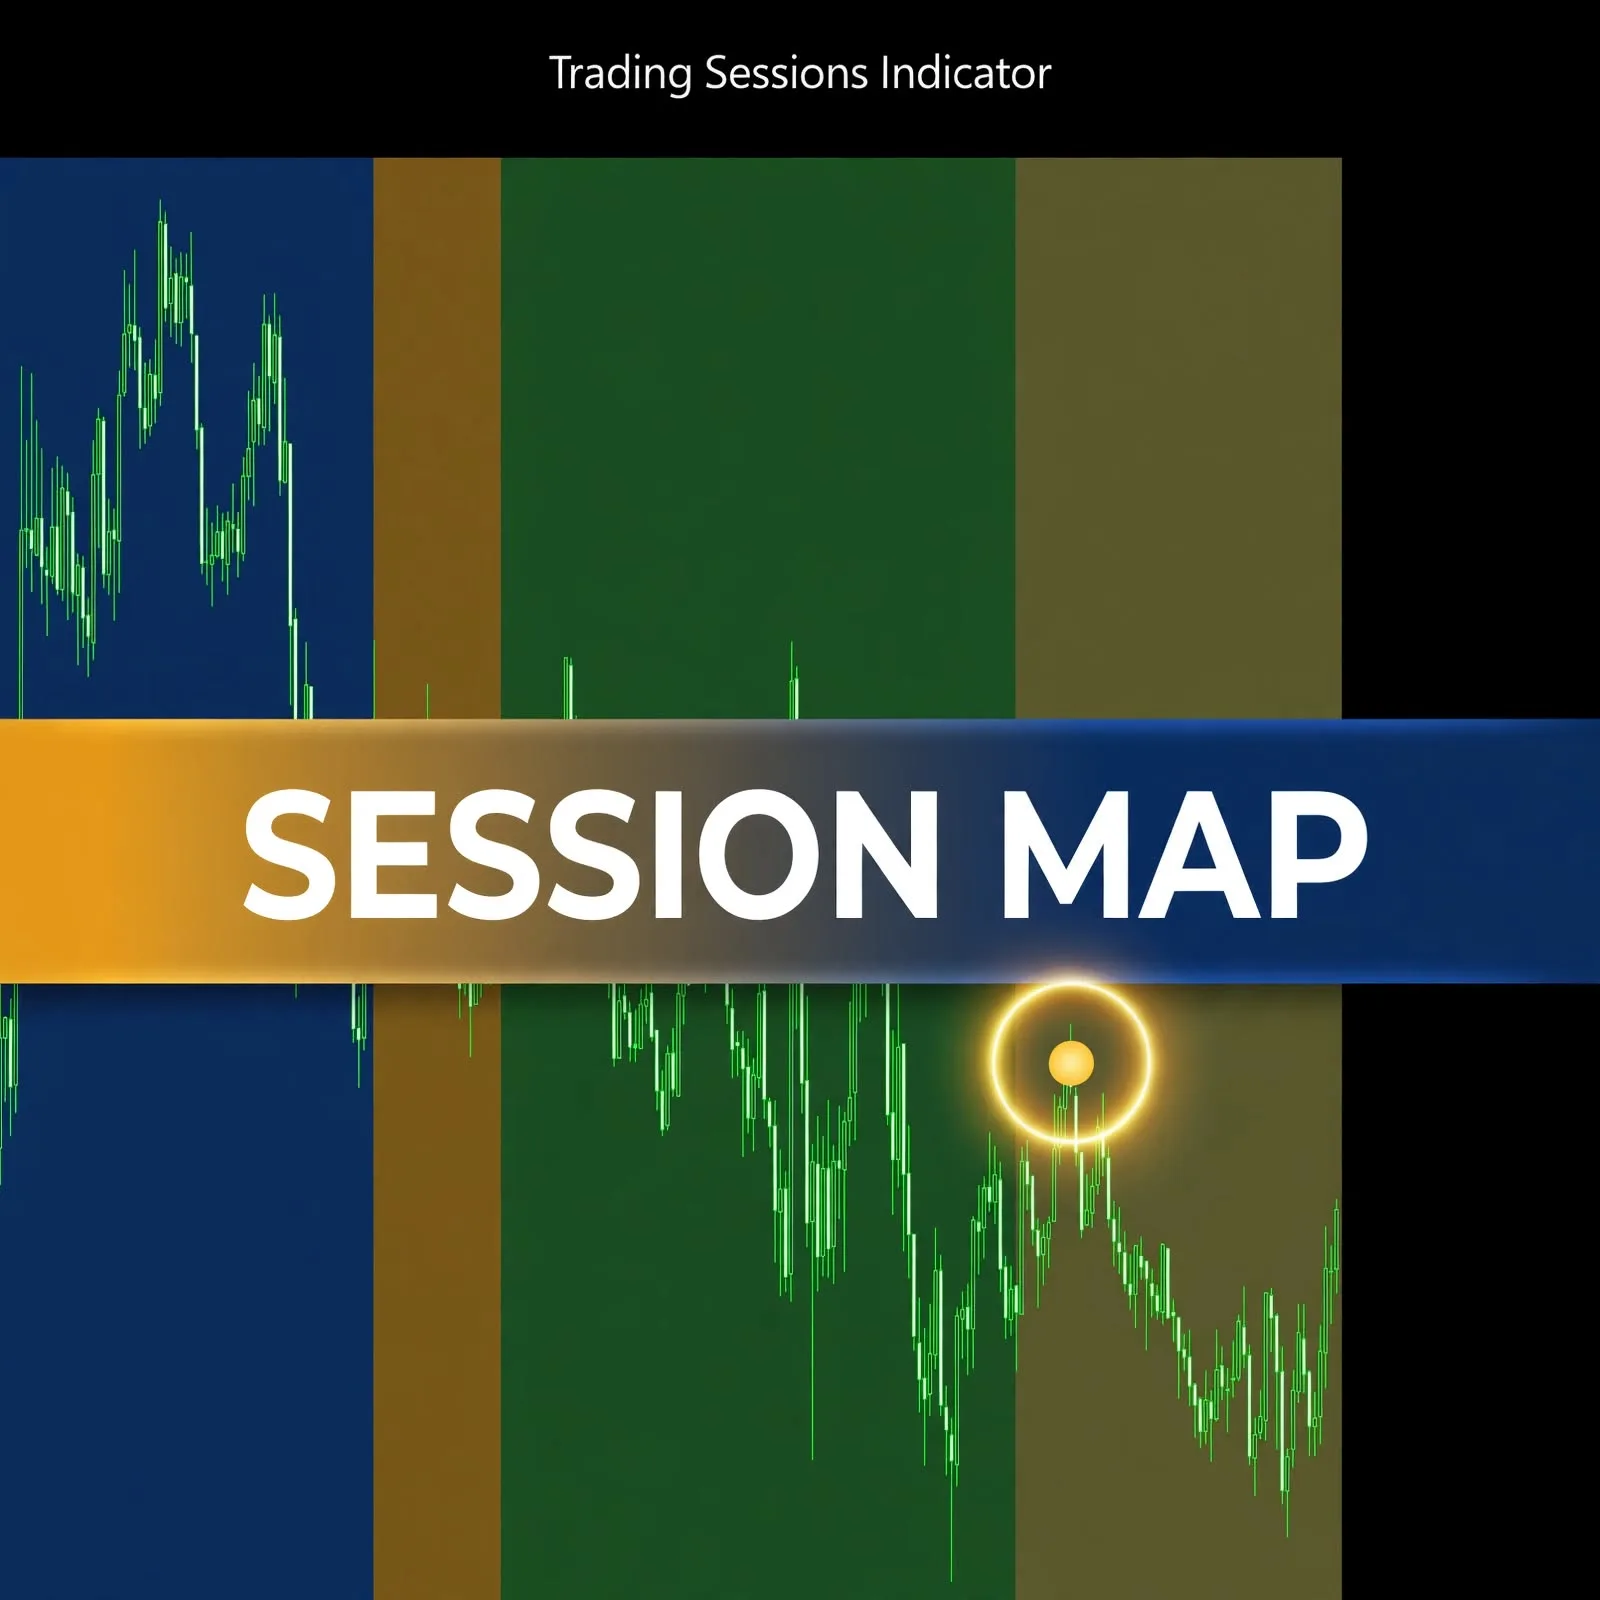
The forex trading sessions explained guide covers why these windows matter. If you want a shaded view instead of lines, the Session Map forex session indicator draws sessions as boxes.
Hours Are Server Time: Default Windows and What You Can Edit
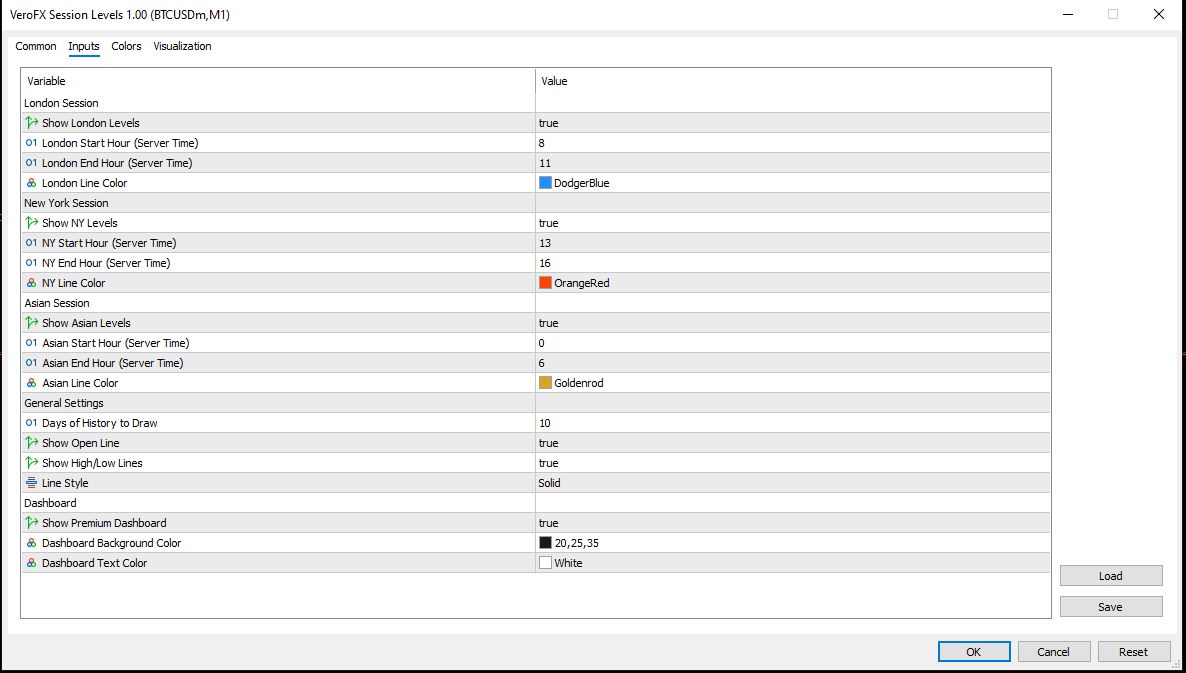
| Session | Default start | Default end | Default color |
|---|---|---|---|
| Asian | 0 | 6 | Goldenrod |
| London | 8 | 11 | DodgerBlue |
| New York | 13 | 16 | OrangeRed |
Start and end hours use your broker’s server time, not your local time. Brokers use different server offsets, so check yours and adjust the hours to the sessions you want. Other inputs include Show High/Low Lines, Show Open Line, Line Style, Show Premium Dashboard, Dashboard Background Color (20,25,35) and Dashboard Text Color (White).
Putting a Custom Indicator Into MT5
In MT5, choose File → Open Data Folder and copy the indicator file into MQL5\Indicators. Restart the terminal or refresh the Navigator, then drag Session Levels onto a chart. It draws in the main chart window. The screenshots show it on BTCUSDm, M1. Run it on a demo account first, and compare the drawn lines with your broker’s session times before relying on them.
A Fit for Traders Who Plan Around Prior Session Ranges
This tool suits traders who use previous session highs, lows and opens as reference points, and anyone who wants those levels drawn consistently without manual work. Pairing the lines with ideas from strong vs weak support resistance zones can help you judge which levels deserve attention.
It is not for traders who want buy or sell signals, automated entries, or a prediction of where price will go. The indicator marks past price levels and shows session status. It does not generate trade decisions.
Where Session Levels Can Mislead You
- Wrong hours, wrong lines. If the start and end hours don’t match your broker’s server time, the lines will describe a different window than you intended.
- Same-day windows only. A session’s start hour must come before its end hour within one day. A window that crosses midnight will not draw.
- Levels are not guarantees. Price can pass through, ignore or reverse near any session level. A line on the chart is a reference, not a reason to enter.
- Timeframe affects precision. Levels are built from the bars of your current chart timeframe, so higher timeframes give coarser session boundaries.
- Data gaps. Missing bars, weekends and thin history can leave some days without lines. Compatibility may vary by broker and account type.
- Crowded charts. With all three sessions, high, low and open lines, and many days of history, a chart can become busy. Reduce the history days or switch off lines you don’t use.
Questions About Server Time, History Days and the Dashboard
Why do my session lines look misaligned?
Check the broker’s server time. The start and end hours are server-time values, so a broker that runs on a different offset will shift the window relative to your expectations. Adjust the hour inputs until the lines match the session you want.
Can I show only the high and low, without the open?
Yes. Set “Show Open Line” to false and keep “Show High/Low Lines” on. You can also reverse it and show only the open lines. Each session can be hidden separately.
How many days of history can I draw?
The default is 10 days, set through “Days of History to Draw”. You can change it. Drawing fewer days keeps the chart cleaner, and the lines depend on the price history available in your terminal.
Does the dashboard update live?
The ACTIVE/CLOSED status checks the current server hour about once a second. The lines themselves are recalculated when a new bar opens on your chart.
Disclaimer
This product is provided for educational and analytical purposes only and is not financial advice. Forex and CFD trading involves a high level of risk, and you can lose some or all of your capital. Leverage can magnify both gains and losses. No product can guarantee profits, and results vary. Never trade with money you can’t afford to lose.
Indicators display information based on historical price data and may produce misleading or delayed signals in some market conditions. They should be used as one part of a complete trading plan with proper risk management.
MetaTrader, MT4, and MT5 are trademarks of their respective owners. This product is not affiliated with or endorsed by MetaQuotes Ltd.