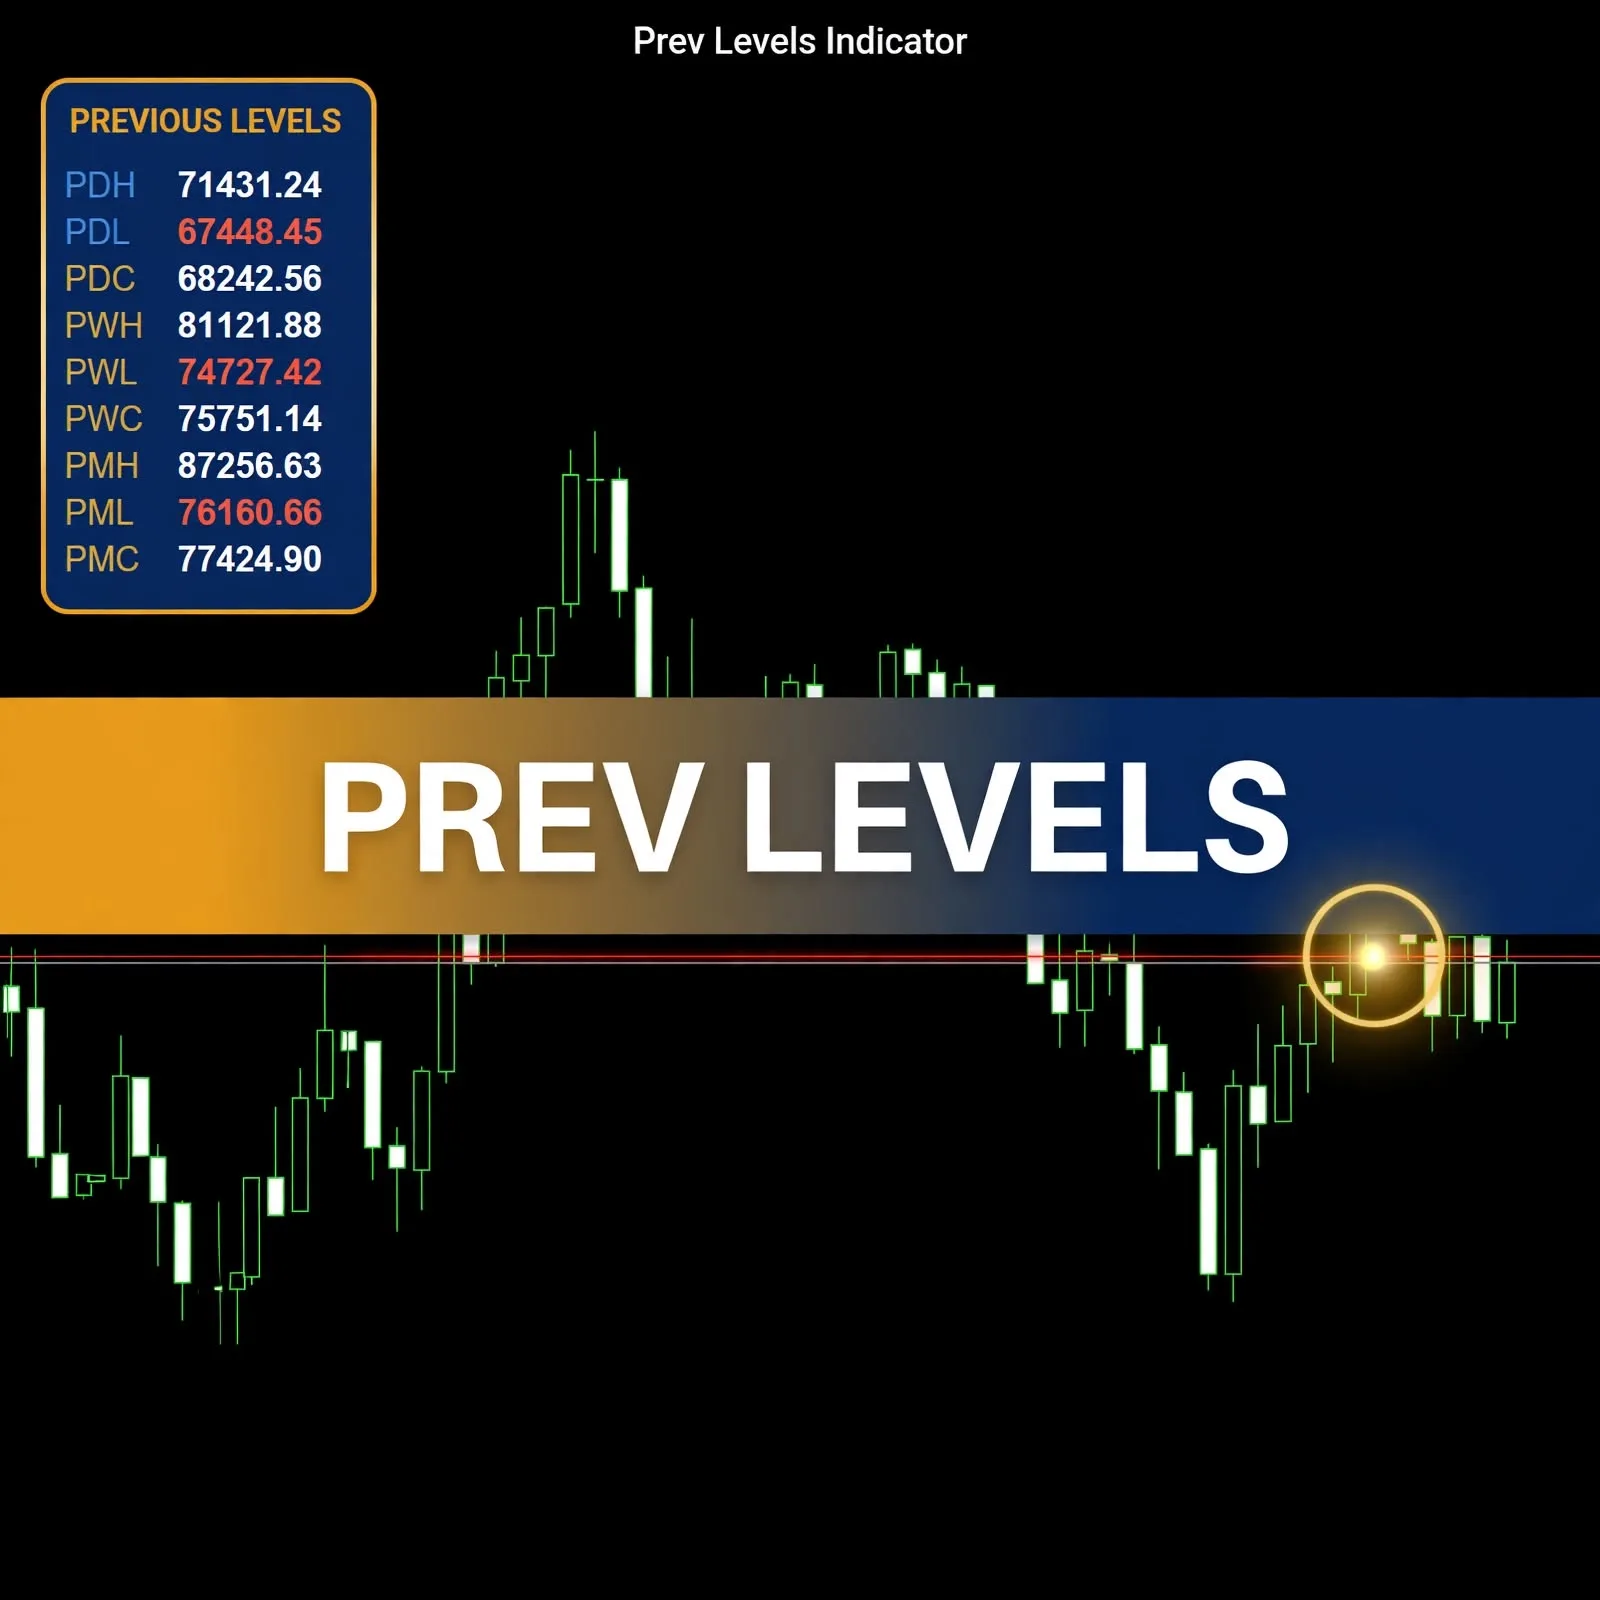
Previous Day, Week & Month High Low Close Levels Indicator for MT5
- Instant Download
- Lifetime Access
- Free Updates
- 24/7 Support
Code: IN22039
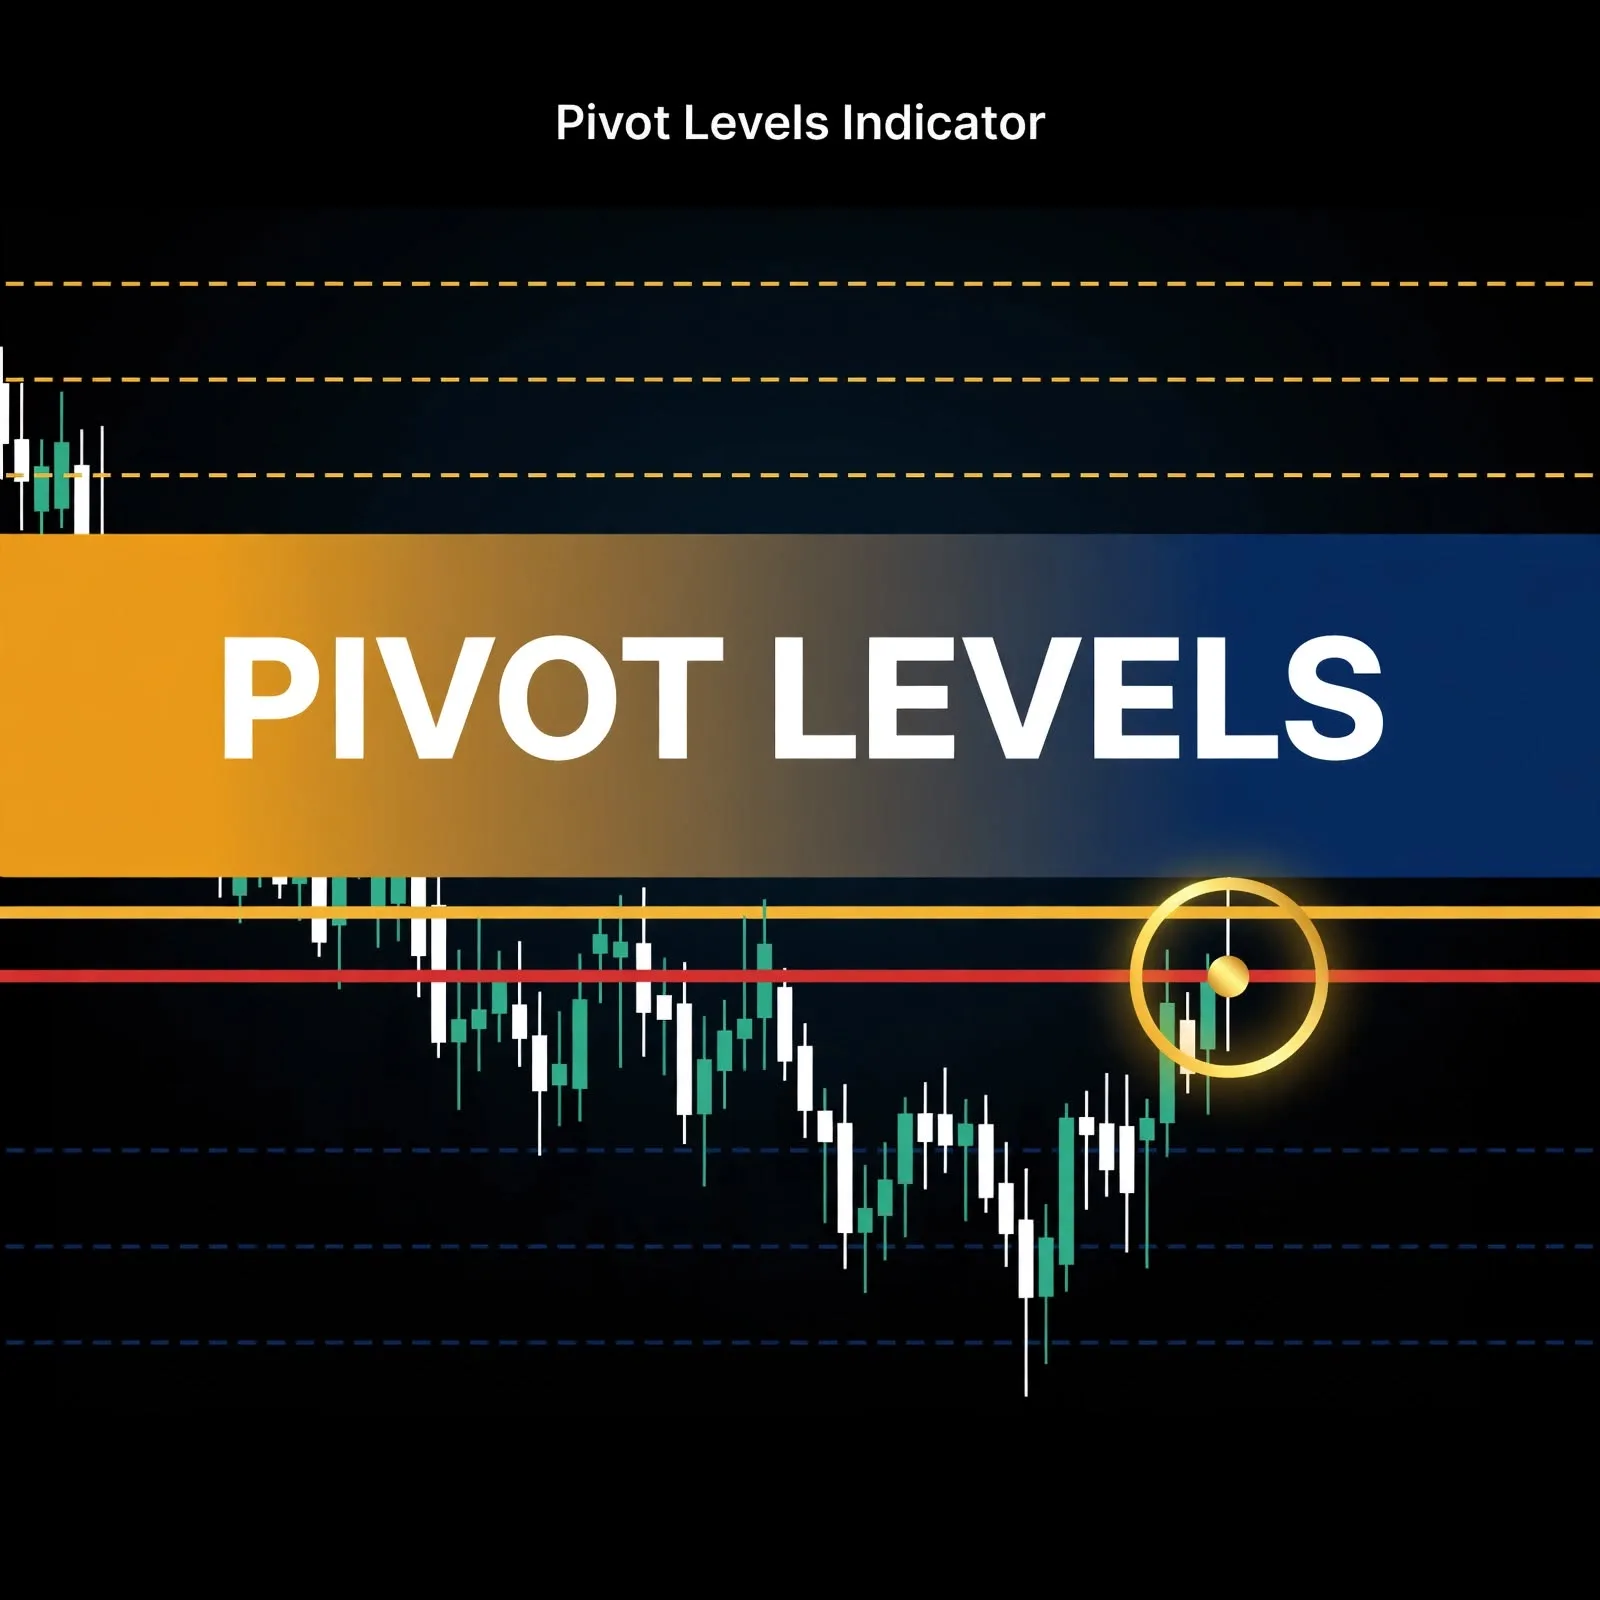
Switch to a daily, weekly and monthly chart just to find last period’s high, low and close, then switch back, and you lose time on every session. This previous day, week and month levels indicator for MT5 puts those nine prices on your working chart as horizontal lines. A legend panel lists every value next to its abbreviation (PDH, PDL, PDC and so on).
Nine Reference Lines From Yesterday, Last Week and Last Month
- Three periods, one chart. Previous Day, Previous Week and Previous Month levels can each be switched on or off.
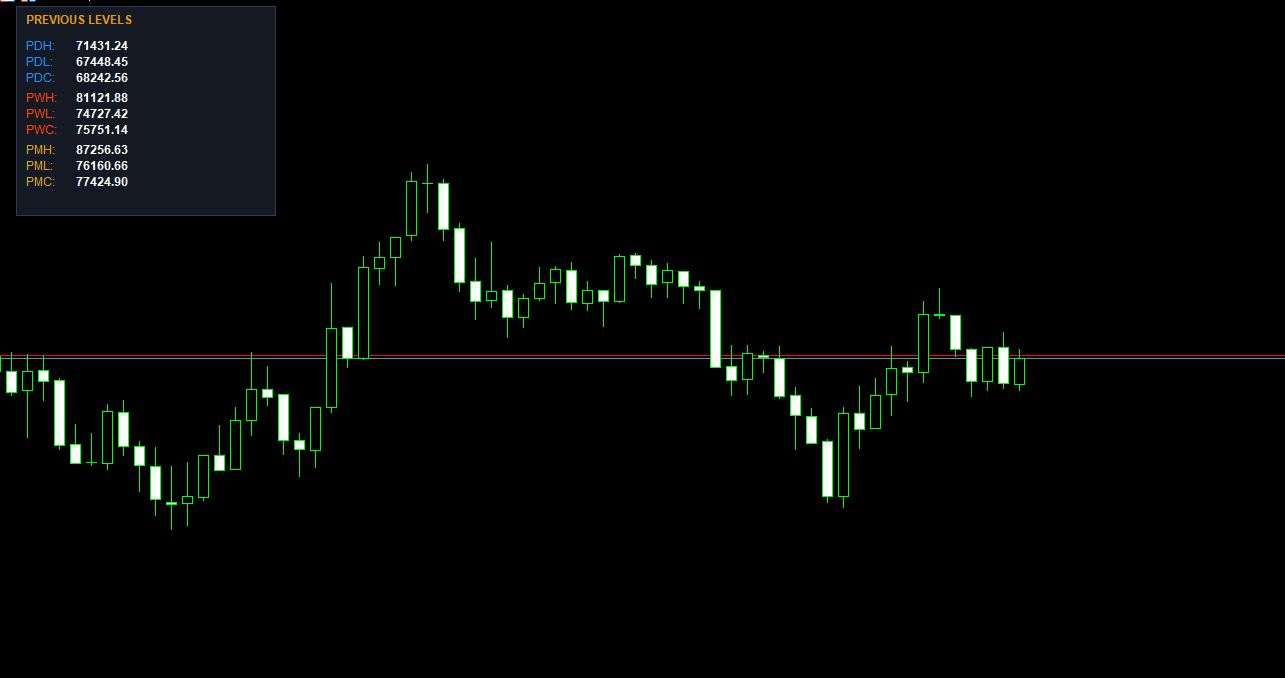
- High, low and close for every period. That gives PDH, PDL and PDC for the day, PWH, PWL and PWC for the week, and PMH, PML and PMC for the month.
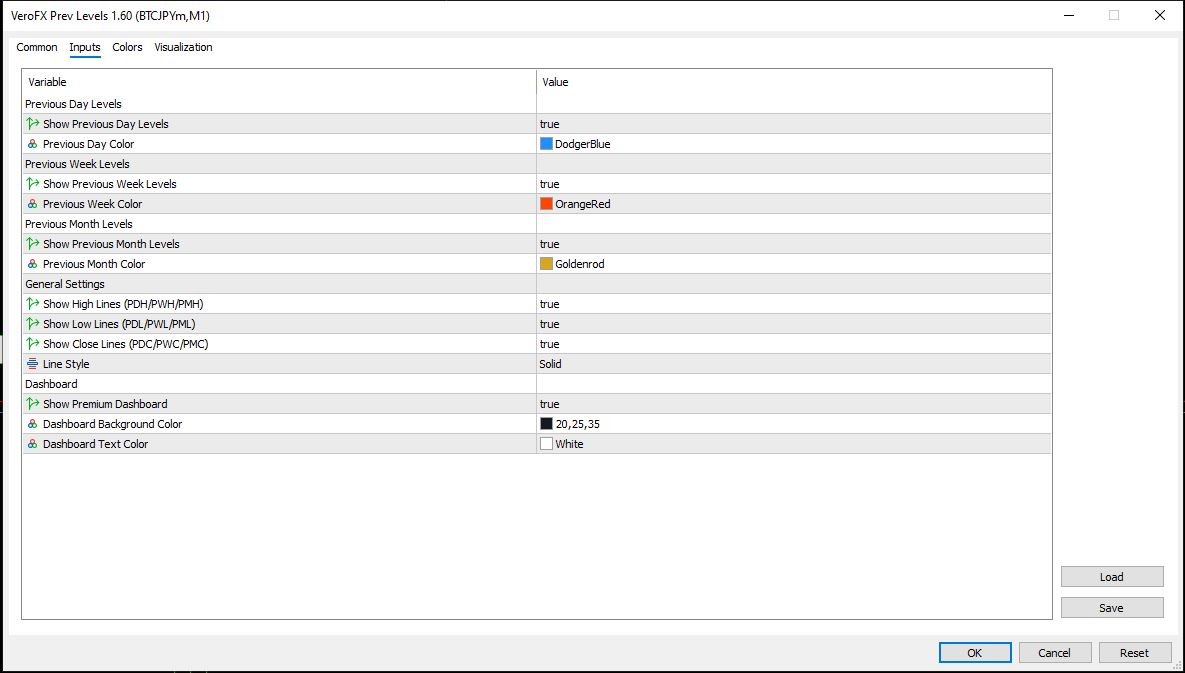
- Separate toggles per line type. Hide all highs, all lows or all closes across periods with three General Settings switches.
- Color by timeframe. Defaults are DodgerBlue for the day, OrangeRed for the week and Goldenrod for the month. Each is editable.
- Close lines look different. High and low lines follow your Line Style choice (Solid by default). Close lines are always dotted, so they stand apart from the extremes.
- Hover labels. Each line carries a tooltip such as “PD High” or “PW Close”.
- A clickable VeroFX.com label sits in the lower-right corner of the chart.
Where the Numbers Come From: Daily, Weekly and Monthly Candles
The indicator reads the last completed candle on the D1, W1 and MN1 timeframes for your symbol. The previous day’s high, low and close come from the previous D1 candle. The weekly and monthly values come the same way from the W1 and MN1 candles. Because these are your broker’s candles, the day, week and month boundaries follow your broker’s server time.
Lines are drawn from the left edge of your visible chart to a point about 50 bars past the current bar, and they are redrawn whenever a new bar forms on your chart.
The Legend Panel: PDH, PDL, PDC and the Rest
The panel in the upper-left corner shows each enabled level as a label and a price, with the price rounded to the symbol’s digits. Labels are tinted in the same color as their lines, so you can match the number to the line at a glance. The panel updates about once a second. The Dashboard Background Color (20,25,35) and Dashboard Text Color (White) are adjustable, and the whole panel can be switched off.
Data Check: Why a Level May Show N/A
Version 1.60 includes a validation step. A level set is skipped, and shows N/A in the panel, when the candle data looks unreliable. That includes a high that isn’t above the low, a range wider than 500% of the low, or a high or low more than three times above or below the current price. This guards against bad history on a symbol, though it can also hide a legitimate level on an extremely volatile instrument.
Putting Prev Levels Into MT5’s Indicators Folder
In MT5, open File → Open Data Folder, place the indicator file in MQL5\Indicators, then restart the terminal or refresh the Navigator. Drag Prev Levels from the list onto any chart. It draws in the main chart window. The screenshots show it on BTCJPYm, M1. Make sure daily, weekly and monthly history has loaded in your terminal, and try it on a demo account first.
For Chart Readers Who Mark Higher-Timeframe Levels, Not for Signal Hunters
This tool suits traders who plan around previous-period extremes and closes, and who prefer one clean chart over flipping between timeframes. It fits well with the pivot levels daily pivot points indicator, since pivots are also built from the prior period’s range. If you are building a chart-reading routine, what is price action trading is a good primer on reading price around levels like these.
It is not for you if you expect buy or sell arrows, automated trades or forecasts. It plots reference prices from completed candles and does nothing else.
Limits of Plotting Last Period’s Levels
- Only the latest completed period. The indicator shows one previous day, one previous week and one previous month. It does not draw earlier days, weeks or months.
- Broker time sets the boundaries. Two brokers can place the daily close at different times, so their levels can differ for the same symbol. Compatibility may vary by broker and account type.
- History must be loaded. Missing D1, W1 or MN1 data can leave levels blank or N/A.
- Lines refresh on new bars. If you scroll or resize the chart, the left edge of the lines is not re-anchored until the next redraw.
- Levels are references, not predictions. Price can pass through, stall at or ignore any previous high, low or close.
- Crowded charts. Nine lines plus a nine-row panel can cover a small chart. Turn off the periods or line types you don’t use.
Levels are only one part of a plan. Why risk management matters more than strategy explains the other part.
Questions About Broker Day Boundaries, N/A Values and Line Colors
Why don’t my levels match another platform?
Daily, weekly and monthly candles depend on the broker’s server time and data feed. A different broker or chart provider can close the day at a different hour, which changes the high, low and close. Compare candles on the same D1 chart to confirm.
Can I show only the previous day’s high and low?
Yes. Keep “Show Previous Day Levels” on and turn off the week and month toggles. Then switch off “Show Close Lines” if you want only the high and low. The legend panel adjusts to the enabled periods.
What does N/A in the panel mean?
It means that period’s levels were unavailable or failed the data check. Common causes are missing higher-timeframe history or unusual price data. Open the D1, W1 and MN1 charts so the terminal can load the history, then reattach the indicator.
Can I change the colors and line style?
Yes. Each period has its own color input, and the Line Style input changes the high and low lines. Close lines stay dotted regardless of that setting.
Disclaimer
This product is provided for educational and analytical purposes only and is not financial advice. Forex and CFD trading involves a high level of risk, and you can lose some or all of your capital. Leverage can magnify both gains and losses. No product can guarantee profits, and results vary. Never trade with money you can’t afford to lose.
Indicators display information based on historical price data and may produce misleading or delayed signals in some market conditions. They should be used as one part of a complete trading plan with proper risk management.
MetaTrader, MT4, and MT5 are trademarks of their respective owners. This product is not affiliated with or endorsed by MetaQuotes Ltd.